Описание
🚀 Более 10 000 трейдеров уже используют наши ТОП индикаторы 🏆
Узнайте, почему профессионалы выбирают нас – самые мощные инструменты на cTrader (индикаторы, алгоритмы и cBots) ждут вас.
👉 Получите все наши ТОП системы здесь:
📌 Индикаторы структуры рынка
- ✅ Advanced Market Structure: Bos, Choch, SwinLevels, Order Blocks, Market Structure & Liquidity Finder
- 🔄 Динамический анализ структуры рынка поворотных точек
- 🧱 Order Block
- ⚖️ Дисбаланс рынка
- ⛓️ BOS & CHOCH
- 🧠 ICT Power of 3
- 🌀 Зоны полярности рынка
🔚 Системы умного выхода
📐 Индикаторы ZigZag
🧱 Индикаторы поддержки и сопротивления
📊 Индикаторы тренда и каналов
- 🔄 Автоматический трендовый канал
- 📊 Супертренд
- 🧠 Адаптивный трендовый канал
- 💥 Система прорыва канала
- 🌈 Динамический градиент тренда
- ⭐ ПРЕМИУМ SSL КАНАЛ
- 🔁 Реактивная скользящая средняя
💧 Инструменты объема и ликвидности
- 🔥 Тепловая карта объема POC
- 📉 Карта ликвидаций с кредитным плечом
- 🔍 Разрыв справедливой стоимости по моментуму
- 🕒 Сессии разрыва справедливой стоимости
⚡ Индикаторы моментума и RSI
- 📈 Триггер тренда RSI
- 🚀 Динамический диапазон моментума
- 🔎 Трекер смещения свечей на нескольких уровнях
🔮 Инструменты прогнозирования и проекции
- 📐 Прогноз на основе линейной регрессии и ATR
- 📏 Мультивременная линейная регрессия Фибоначчи
- 📈 Проектор рыночного потока на основе объема
Анализатор тренда моментума 🚀📊
Продвинутый технический алгоритм, предназначенный для определения направления рыночного тренда и оценки его силы, интегрируя несколько аналитических метрик. Этот индикатор сочетает в себе экспоненциальные скользящие средние (EMA), скорость изменения (RoC), волатильность, относительную силу и объем, чтобы предоставлять четкие, практические сигналы. Ниже мы разбираем его функциональность и логику расчетов.
Ключевые компоненты 🔧
Алгоритм построен на пяти основных элементах, работающих в синергии:
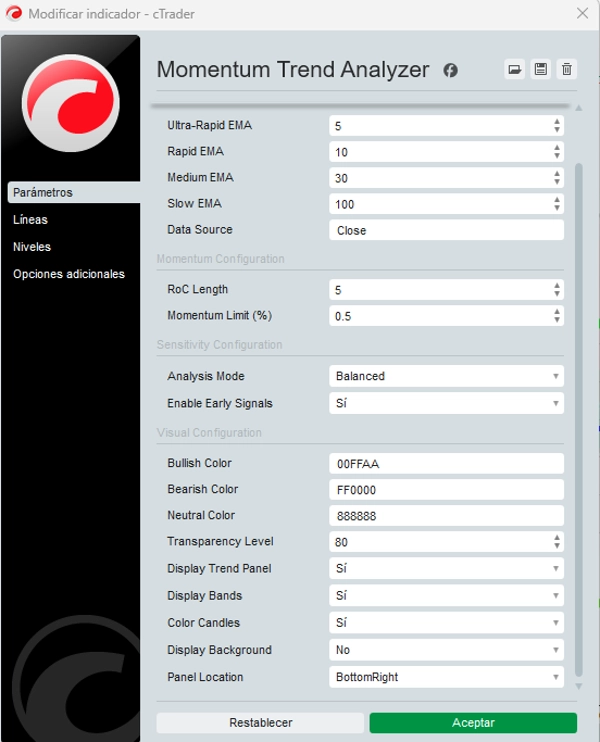
- Экспоненциальные скользящие средние (EMA) 📈
-
- Использует четыре EMA с разными периодами: ультрабыстрая, быстрая, средняя и медленная — обычно рассчитываются по ценам закрытия.
- Краткосрочные EMA (ультрабыстрая и быстрая) выявляют немедленные движения, в то время как долгосрочные EMA (средняя и медленная) отражают устойчивые тренды.
- Скорость изменения (RoC) ⚡
-
- Измеряет процентное изменение цены за определенный период, служа прямым индикатором моментума.
- Сглаженный RoC фильтрует мелкие колебания и стабилизирует сигнал.
- Нормализованный средний истинный диапазон (ATR) 🌪️
-
- ATR количественно оценивает историческую волатильность, нормализованную путем деления на текущую цену для относительной оценки.
- Высокий нормализованный ATR сигнализирует об увеличенной волатильности, влияя на интерпретацию силы тренда.
- Индекс относительной силы (RSI) 💪
-
- Этот осциллятор измеряет величину и скорость ценовых движений, выявляя перекупленность/перепроданность.
- Помогает оценить интенсивность моментума внутри тренда.
- Средний объем 🔊
-
- Простая скользящая средняя объема торгов выявляет периоды высокой активности, усиливая достоверность сигнала.
Логика расчета 🧠
Анализатор тренда моментума генерирует сигналы тренда и силы через комбинацию конкретных условий и расчетов:
1. Определение тренда
- 🟢 Бычий тренд: Подтверждается, когда быстрая EMA > средняя EMA, средняя EMA > медленная EMA, и цена закрытия > быстрая EMA.
- 🔴 Медвежий тренд: Подтверждается, когда быстрая EMA < средняя EMA, средняя EMA < медленная EMA, и цена закрытия < быстрая EMA.
- ⚪ Нейтральный тренд: Возникает, когда ни одно из условий не выполняется, указывая на консолидацию или неопределенность.
2. Ранние сигналы тренда 🔍
- Обнаруживает потенциальные изменения тренда до полного подтверждения с помощью:
-
- Ультрабыстрая EMA
- Наклон быстрой EMA
- Сглаженный RoC
- Пример: Ранний бычий сигнал срабатывает, если ультрабыстрая EMA пересекает быструю EMA сверху, наклон быстрой EMA положительный, а сглаженный RoC превышает порог моментума.
3. Регулировка чувствительности ⚖️
Доступны три режима:
- 🛡️ Консервативный: Приоритет подтвержденным сигналам, минимизация ложных срабатываний (медленное обнаружение).
- ⚔️ Агрессивный: Предпочитает ранние сигналы для более быстрой реакции (больший риск).
- ⚖️ Сбалансированный: Средний подход.
4. Расчет силы тренда 💯
Сила определяется через взвешенную интеграцию следующих факторов:
- Разброс EMA: Расстояние (%) между быстрой и медленной EMA.
- Вклад RSI: Разница между RSI и 50 (бычий/медвежий).
- Волатильность (нормализованный ATR): Корректирует силу в зависимости от рыночных колебаний.
- Относительный объем: Сила увеличивается, если текущий объем > среднего.
- Моментум (сглаженный RoC): Измеряет скорость движения.
- Результат: Процент силы (0%-100%) — более высокие значения означают устойчивые тренды.
5. Динамические полосы 🎯
- Три верхние/нижние полосы основаны на последних максимумах/минимумах цены.
- Служат динамическими уровнями поддержки/сопротивления, адаптируясь к волатильности рынка.
Практическое применение для трейдеров 💼
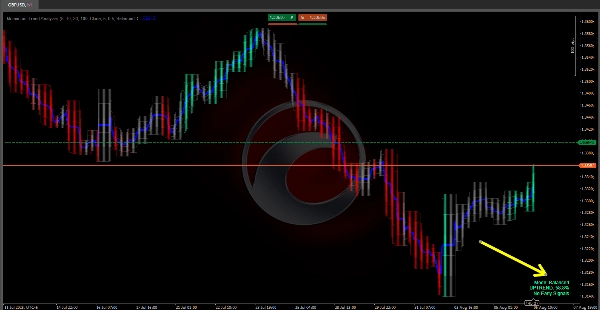
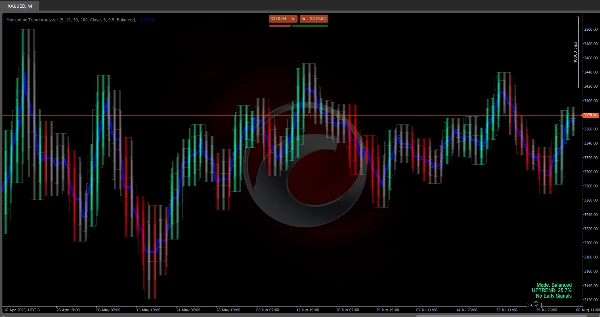
- 📊 Визуализация: Тренд отображается цветовой заливкой (🟢 бычий, 🔴 медвежий, ⚪ нейтральный) + линия тренда.
- 💪 Сила: Процентное значение (например, 24.3% = осторожность; >50% = высокая уверенность).
- 🔄 Стратегия по полосам:
-
- Бычья: Покупать на нижних полосах, продавать на верхних.
- Медвежья: Продавать на верхних полосах, покрывать на нижних.
- 🚨 Ранние сигналы: Помогают агрессивным трейдерам предвидеть быстро меняющиеся рынки.
- 🛠️ Гибкость: Режимы чувствительности адаптируются к консервативному (ожидание подтверждения) или агрессивному (раннее действие) стилям.
Заключение 🎯
Анализатор тренда моментума предоставляет комплексный анализ тренда и моментума, объединяя EMA, RoC, нормализованный ATR, RSI и объем. Его логика расчета — основанная на четких условиях и взвешенных факторах — адаптируется к разным уровням риска и торговым стратегиям, делая его мощным инструментом для трейдеров.
Сводка
The indicator determines bullish, bearish, or neutral trends based on EMA relationships and price positioning. It provides early trend shift signals using ultra-fast EMA, fast EMA slope, and smoothed RoC. Users can select from three sensitivity modes—conservative, balanced, and aggressive—to adjust signal responsiveness according to their trading style.
Trend strength is calculated as a weighted integration of EMA spread, RSI deviation from neutral, normalized volatility, relative volume, and momentum, expressed as a percentage from 0% to 100%. The indicator also features dynamic bands derived from recent price highs and lows, serving as adaptive support and resistance levels.
Visualization includes colored shading to indicate trend direction and a trendline, with strength values aiding decision-making. The band strategy suggests buying near lower bands and selling near upper bands in bullish trends, and the reverse in bearish trends. This tool supports diverse risk levels and trading strategies by providing comprehensive trend and momentum analysis.