
Daily Open Color Zones
Индикатор
346 скачивания
Версия 1.0, Sep 2025
Windows, Mac
4.0
Отзывы: 1
Описание
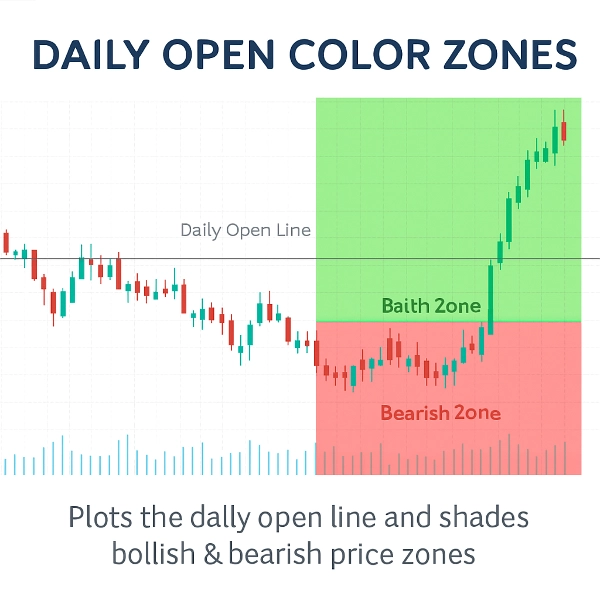
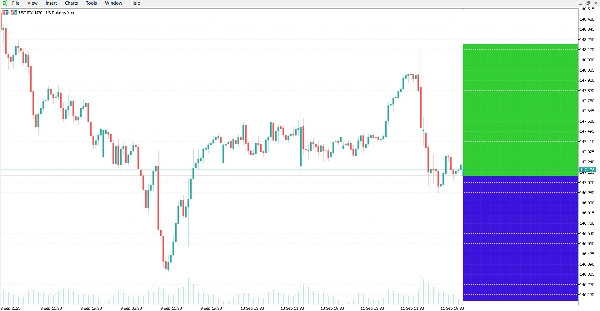
Этот индикатор отображает линию дневного открытия и выделяет бычьи и медвежьи ценовые зоны вокруг неё.
Он предоставляет чёткую визуальную ссылку, чтобы увидеть, торгуется ли рынок выше или ниже дневного открытия, что является часто используемым уровнем в внутридневном анализе.
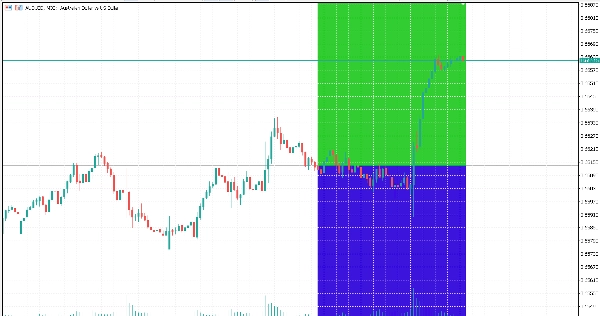
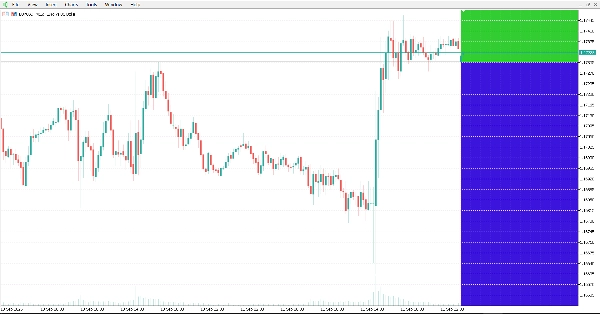
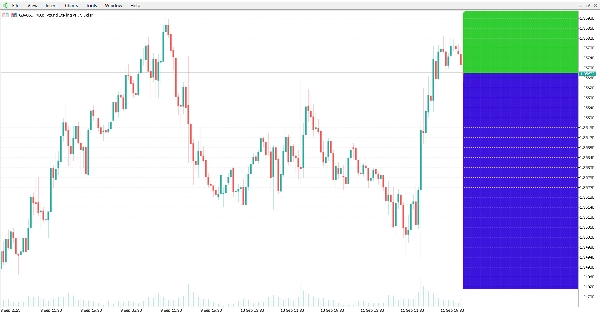
Индикатор автоматически рисует горизонтальную линию на цене дневного открытия и выделяет области графика:
- Зелёная зона выше линии (бычья область).
- Красная зона ниже линии (медвежья область).
Особенности:
- Автоматическая линия дневного открытия: точное отображение цены дневного открытия.
- Цветные зоны: легко различать бычьи и медвежьи области с настраиваемыми цветами.
- Динамическое обновление: зоны автоматически подстраиваются с каждой новой свечой.
- Настраиваемый внешний вид: можно изменить стиль линии, толщину и цвета зон.
- Лёгкий и эффективный: разработан для минимального использования процессора.
- Работает со всеми символами и таймфреймами.
Заключение:
Индикатор предлагает чёткую визуализацию на графике дневного открытия и связанных с ним бычьих/медвежьих зон. Его можно применять к различным рынкам и таймфреймам для технического анализа.
Сводка
ИИ-сводка
The Daily Open Color Zones indicator visually marks the daily open price on trading charts by automatically plotting a horizontal line at this level. It shades the price area above the daily open line in green to indicate bullish zones and the area below in red to indicate bearish zones. These color-coded zones update dynamically with each new candle, providing real-time visual cues about market direction relative to the daily open. The indicator supports all symbols and timeframes, making it applicable across various markets including Forex, cryptocurrencies, and commodities like gold (XAUUSD). Users can customize the line style, thickness, and zone colors to suit their preferences. Designed to be lightweight, it minimizes CPU usage while offering clear intraday reference points commonly used in technical analysis and scalping strategies.
Профиль индикатора
Отзывы покупателей
4.0
Отзывы: 1
5 | 0 % | |
4 | 100 % | |
3 | 0 % | |
2 | 0 % | |
1 | 0 % |
Отзывы покупателей
October 20, 2025
Clean and visual 🎨 - Daily Open Zones make trend bias crystal clear. Great tool for intraday planning and momentum entries!
Обсуждение
Частые вопросы
Forex
Scalping
EURUSD
Crypto
Grid
XAUUSD
Продукты, доступные в cTrader Store, включая торговых ботов, индикаторы и плагины, предоставляются сторонними разработчиками и доступны исключительно в информационных и технических целях. cTrader Store не является брокером и не предоставляет инвестиционные консультации, персональные рекомендации или какие-либо гарантии будущей доходности.


Цена
С 13/09/2025
27
Продажи
5.41K
Бесплатные установки