
Описание
Индекс давления ликвидности — это профессиональный инструмент, предназначенный для того, чтобы дать трейдерам более глубокое понимание скрытой динамики рыночной ликвидности. В отличие от традиционных осцилляторов, которые реагируют только на цену, Индекс давления ликвидности объединяет объем тиков, сжатие волатильности и направленный поток в одну легко читаемую линию. Это делает его мощным помощником для трейдеров, которые хотят понять, действительно ли давление покупателей или продавцов доминирует за свечами.
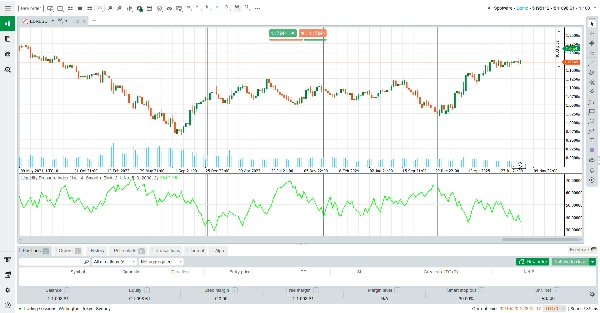
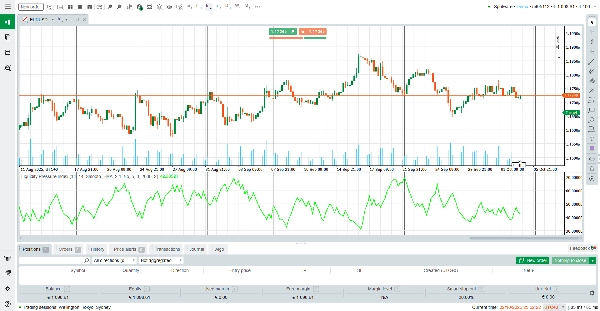
В своей основе ALB вычисляет баланс между накопленной покупательной ликвидностью и накопленной продажной ликвидностью, нормализуя результат относительно скользящего объема тиков. Выходные данные центрированы вокруг нейтрального уровня 50. Значения выше 50 указывают на более сильную покупательскую ликвидность, тогда как значения ниже 50 подчеркивают более сильную продажную ликвидность.
Этот простой визуальный сигнал позволяет трейдерам мгновенно оценить базовый поток ордеров без необходимости интерпретировать несколько индикаторов одновременно.
Как читать индикатор
Линия выше 50: Рынок показывает более сильную покупательскую ликвидность. Это часто поддерживает бычье продолжение или сигнализирует о скрытом спросе, поглощающем ордера на продажу.
Линия ниже 50: Рынок показывает более сильную продажную ликвидность. Это часто поддерживает медвежье продолжение или сигнализирует о скрытом предложении, поглощающем ордера на покупку.
Плоская линия или около 50: Ликвидность сбалансирована, что указывает на неопределенность или консолидацию.
Опции сглаживания: Трейдеры могут выбирать между EMA или KAMA для снижения шума и сосредоточения на доминирующем тренде ликвидности.
Как это работает
Индикатор сначала измеряет истинный диапазон волатильности (ATR) и сравнивает его с фактическим диапазоном свечи для оценки сжатия. Затем он объединяет это с объемом тиков, чтобы отделить ожидаемую ликвидность (ордера, ожидающие в книге) от исполненной ликвидности (ордера, уже выполненные). В зависимости от направления свечи алгоритм распределяет скрытое поглощение покупок или продаж. Наконец, результат нормализуется относительно скользящей EMA объема тиков, масштабируется и сглаживается для ясности.
В итоге получается динамический индекс ликвидности, который адаптируется к рыночным условиям и в реальном времени показывает противостояние между покупателями и продавцами.
Ключевые особенности
Фокус на ликвидности: Выходит за рамки цены, чтобы показать скрытое давление покупателей и продавцов.
Адаптивное сглаживание: Выбор между EMA и KAMA для снижения шума.
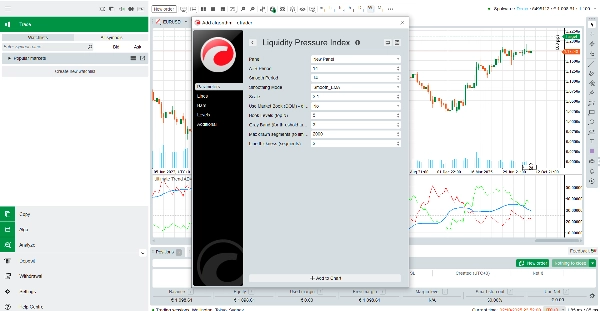
Настраиваемые параметры: Управление периодом ATR, длиной сглаживания, масштабом и толщиной линии.
Оптимизированная производительность: Легкий дизайн с ограничениями сегментов для обеспечения плавного отображения графика.
Почему стоит использовать Индекс давления ликвидности?
На быстро меняющихся рынках одна только цена может вводить в заблуждение. Advanced Liquidity Balance предоставляет трейдерам более глубокую перспективу, показывая, действительно ли рынок поддерживается ликвидностью или движения происходят при слабом участии. Независимо от того, являетесь ли вы скальпером, ищущим краткосрочные дисбалансы, или свинг-трейдером, подтверждающим силу тренда, Индекс давления ликвидности предлагает профессиональный взгляд на ликвидность — и что самое лучшее, он полностью бесплатен.
Скачайте его сегодня и добавьте новое измерение ясности в свои торговые решения.
Сводка
Отзывы покупателей
5 | 0 % | |
4 | 100 % | |
3 | 0 % | |
2 | 0 % | |
1 | 0 % |