
On Balance Volume
Indikator
247 unduhan
Versi 1.0, Dec 2024
Windows, Mac
5.0
Ulasan: 1
Deskripsi
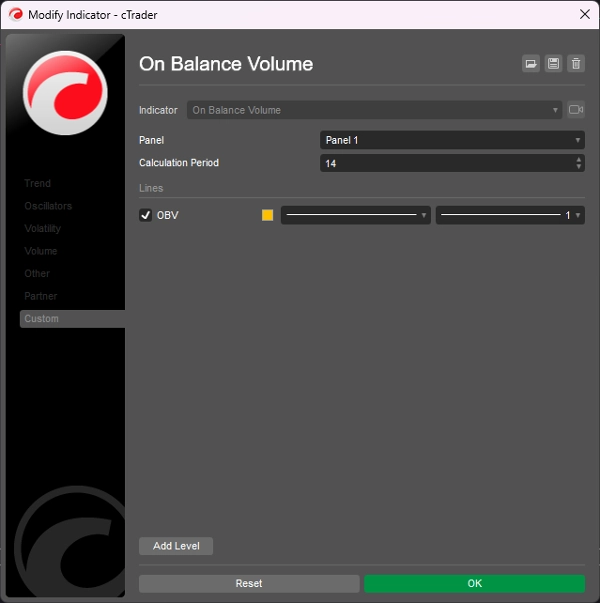
On Balance Volume (OBV) mengukur tekanan beli dan jual sebagai indikator kumulatif yang menambahkan volume pada hari naik dan mengurangi volume pada hari turun.
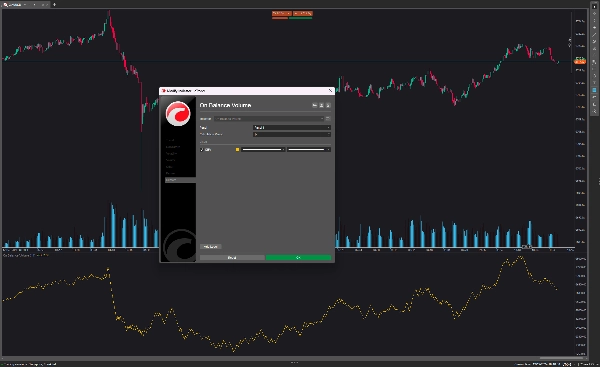
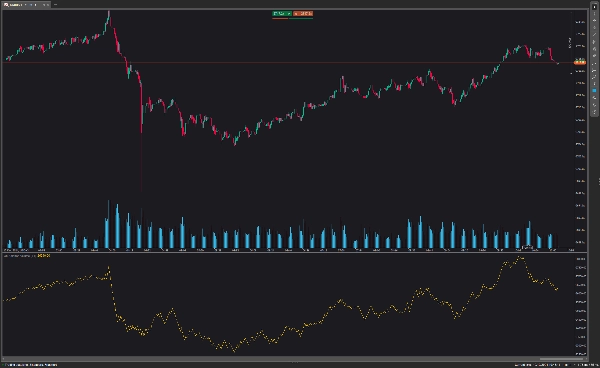
On Balance Volume ditampilkan di bagian bawah grafik. Garis OBV naik ketika harga penutupan hari ini meningkat dan turun ketika harga penutupan kemarin lebih tinggi dari harga saat ini.
Indikator OBV umumnya mengidentifikasi breakout sebelum garis harga melakukannya dan membantu dalam menetapkan tren naik yang jelas. Jika Anda ingin berdagang dengan strategi ini, Anda membuka posisi forex pada level harga breakout dan menempatkan stop loss di atas ayunan tertinggi terbaru
Ringkasan
Ringkasan AI
On Balance Volume (OBV) is a technical indicator that measures buying and selling pressure by cumulatively adding volume on days when the closing price rises and subtracting volume on days when it falls. Displayed at the bottom of the chart, the OBV line moves upward when today's closing price exceeds the previous day's and moves downward when it is lower. This indicator is used to identify potential breakouts ahead of price movements and to confirm upward trends. Traders using OBV may open positions at breakout price levels and set stop losses above recent high swings. The indicator is applicable in forex markets and supports breakout trading strategies.
Profil indikator
Ulasan pelanggan
5.0
Ulasan: 1
5 | 100 % | |
4 | 0 % | |
3 | 0 % | |
2 | 0 % | |
1 | 0 % |
Ulasan pelanggan
August 18, 2025
Pros: A lightweight cumulative volume indicator that confirms price moves and detects divergences. Excellent for analyzing trend strength and sentiment. Cons: No alerts, tooltips, or template features. Signals may lag in volatile or manipulated markets.
Diskusi
Pertanyaan umum
Forex
Breakout
Produk-produk yang tersedia melalui cTrader Store, termasuk bot trading, indikator, dan plugin, disediakan oleh pengembang pihak ketiga serta hanya ditujukan untuk akses teknis dan informasi. cTrader Store bukan broker dan tidak menyediakan saran investasi, rekomendasi pribadi, atau jaminan apa pun tentang kinerja di masa mendatang.
Produk lain dari penulis ini


Harga
2
Penjualan
6.9K
Instal gratis