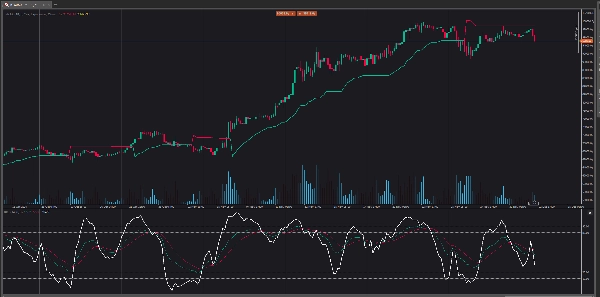
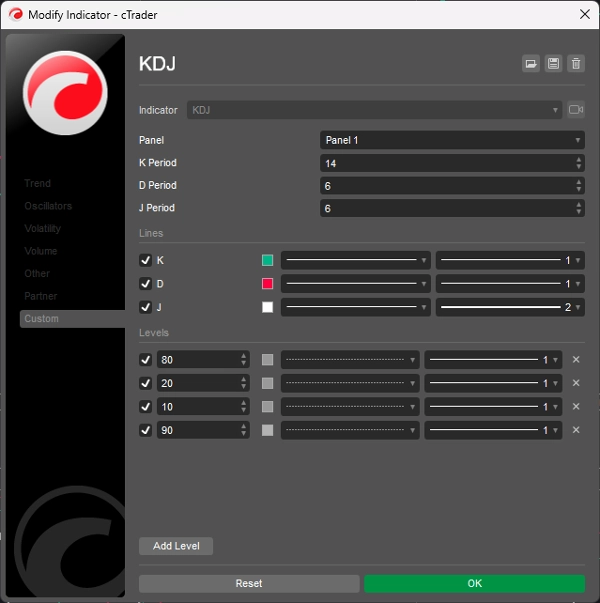
Broker & Prop
Untuk bisnis
00
Days
:
00
Hours
:
00
Minutes
:
00
Seconds
KDJ
Logo "KDJ"
5.0
03/09/2025
208
Desktop
Sejak 03/10/2024
Penjualan
2
Instal gratis
6046
Gambar unggahan "KDJ"Gambar unggahan "KDJ"

The KDJ oscillator display consists of 3 lines (K, D and J - hence the name of the display) and 2 levels. K and D are the same lines when using the stochastic oscillator. The J line represents the deviation of the D value from the K value. The convergence of these lines indicates new trading opportunities. Like the Stochastic Oscillator, oversold and overbought levels correspond to the times when the trend is likely to reverse.

5.0
Ulasan: 1
5
100 %
4
0 %
3
0 %
2
0 %
1
0 %
Ulasan pelanggan
August 18, 2025
Pros: Three-line stochastic oscillator (K, D, J) that identifies overbought/oversold levels and momentum shifts. Supports divergence analysis and crossovers between K and D as trading signals. Lightweight and responsive. Cons: No alerts, tooltips, or settings presets. J‑line can generate outlier v
Produk lain dari penulis ini
Peringkat teratas
Gratis
Indikator
ATR
Supertrend
PMAX
It's a combination of two trailing stop loss and the other one is well-known ATR-based SuperTrend.
cBot
Grid
RSI
XAUUSD
+18
Investion X V1.9 - Intelligent Filter-Based Trading System
Trading system combining martingale strategy with multi-layered technical analysis and comprehensive protection features
Indikator
RSI
Indices
StochasticRSI
Stochastic RSI (StochRSI) is a technical indicator used to measure the strength and weakness of the RSI.
Indikator
Indices
AI
Machine Learning Momentum Index
The Machine Learning Momentum Index (MLMI) represents the next step in oscillator trading.
Laguerre RSI
Laguerre RSI is based on John EHLERS' Laguerre Filter to avoid the noise of RSI.
Indikator
Breakout
Forex
On Balance Volume
On Balance Volume (OBV) measures buying and selling pressure as a cumulative indicator.
Quantitative Qualitative Estimation
The QQE (Quantitative Qualitative Estimation) Weighted Oscillator improves its original version by weighting the RSI.
Indikator
Breakout
Stocks
Signal
Darvas Box
The Darvas Box involves identifying "boxes" or trading ranges where a stock's price consolidates before breaking out.
Indikator
Indices
Breakout
Stocks
+3
Ichimoku Cloud Indicator
The Ichimoku Cloud is a comprehensive technical analysis system developed by Japanese journalist Goichi Hosoda
Chaikin Money Flow
Chaikin money flow's primary purpose is to distinguish between periods of accumulation and distribution of a security.
cBot
Grid
Martingale
Investion Basic
This is a basic martingale bot without an indicator. For long and short trading options at the same bot.
Anda mungkin juga suka
[Stellar Strategies] Inside Bar with Signals
Visually master the Inside Bar strategy with clear breakout signals and professional chart highlighting 📈🔔📉
Peringkat teratas
Gratis
Indikator
Breakout
Forex
Signal
+2
MACD Plus
A visually enhanced MACD with colored histograms to clearly show trend strength.
Cumulative Delta_noSourceCode
Demo of my main indcator.
Indikator
RSI
Forex
Signal
+2
Rsi_custom
🔹 Advanced RSI with smart alerts and visual signals for faster trend reversal detection.
Indikator
RSI
Indices
Commodities
+3
FiboTrend-Pro V2
New version of one of my favorites includes Fibonacci and moving average convergence divergence lines
Indikator
Indices
Forex
POC session line
Displays the POC line for previous sessions in an easy to see manner.
Tape reader
TAPE READER :-)
Indikator
RSI
XAUUSD
Breakout
+1
ZigzagSR
Automatic ZigZag swings with dynamic support & resistance levels, labeling highs/lows for clear trend signals.
Indikator
Signal
MACD
USDJPY
PulseTracker
Version 1.2: Advanced Trend Detection & Visualization System
Indikator
Grid
NAS100
NZDUSD
+15
SystemAlgo1
Institutional Supply & Demand Mapping Across Five Timeframes — Automatically.
Area of Interest
Area of Interest with the power of AI to detect the market interest.
Indikator
Indices
Forex
Signal
+2
Golden Boom And Crash Spike Detector
Golden Boom and Crash Spike Detector is a trading tool designed for Crash 300 and Boom 300 indices on M1 Timeframe.