
Deskripsi
🌟 **Apa itu Z-Score?** 🌟
• **Z-Score dalam Trading**: Ini adalah cara untuk mengukur seberapa jauh harga saat ini dari rata-rata terbarunya, dinyatakan dalam satuan deviasi standar. 😊 Nilai yang mendekati 0 menunjukkan bahwa harga berada dekat dengan rata-ratanya, sementara nilai tinggi (positif atau negatif) 😮 menunjukkan bahwa harga telah menyimpang secara signifikan.
• **Kegunaan Statistik**: Nilai-nilai ini memungkinkan Anda mengidentifikasi situasi di mana harga "overbought" 📈 atau "oversold" 📉, yang dapat berguna untuk strategi mean reversion atau untuk mendeteksi momen volatilitas tinggi 💥.
🌟 **Cara Kerja Indikator** 🌟
1. **Perhitungan Rata-rata dan Deviasi**:
- Sejumlah bar (atau periode) sebelumnya yang spesifik dianalisis untuk menghitung rata-rata harga penutupan dan deviasi standarnya. 🧮
- Dengan nilai-nilai ini, ditentukan seberapa jauh harga saat ini menyimpang dari rata-rata. Perbedaan ini dinyatakan sebagai Z-Score.
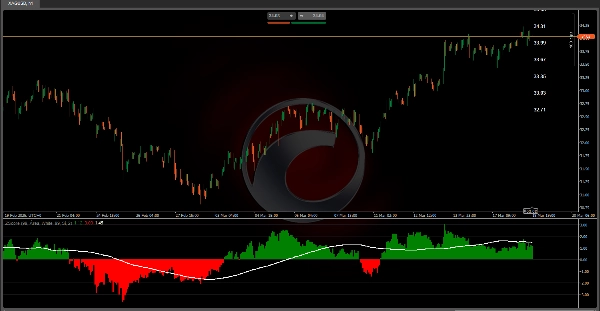
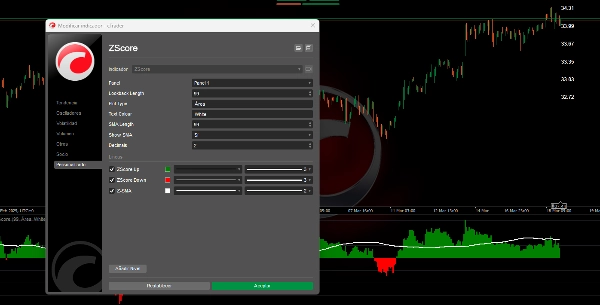
2. **Visualisasi Z-Score**:
- **Mode Area**: Dua histogram ditampilkan: satu berwarna hijau 🟩 untuk nilai positif (ketika harga di atas rata-rata) dan satu lagi berwarna merah 🔴 untuk nilai negatif (ketika di bawah). Ini memungkinkan Anda mengidentifikasi secara visual besaran dan arah penyimpangan.
3. **Rata-rata Bergerak dari Z-Score**:
- Rata-rata bergerak dihitung atas nilai-nilai Z-Score. Ini membantu meratakan fluktuasi dan mengidentifikasi tren dalam bagaimana penyimpangan harga berperilaku dari waktu ke waktu. 📊
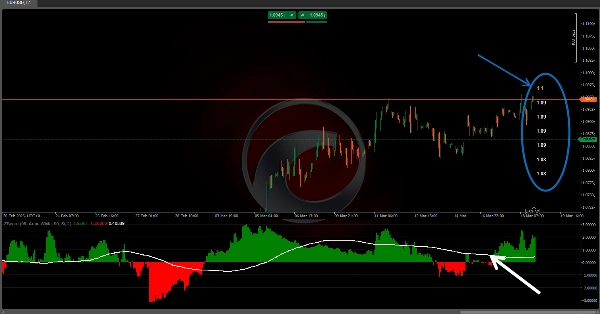
4. **Zona Probabilitas dan Label Referensi**:
- Selain itu, label ditempatkan pada grafik yang menunjukkan harga yang sesuai dengan rata-rata dan setiap tingkat deviasi. Ini berguna untuk memahami, dalam istilah harga, seberapa "ekstrem" perilaku pasar. ⚠️
---
🌟 **Interpretasi dan Aplikasi untuk Trader** 🌟
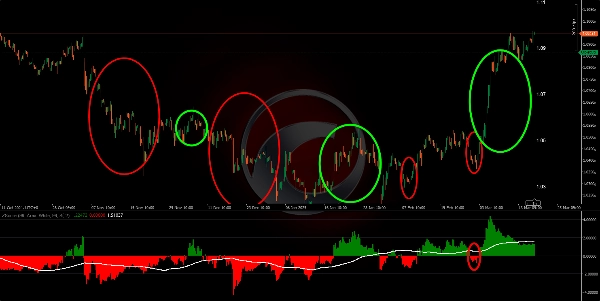
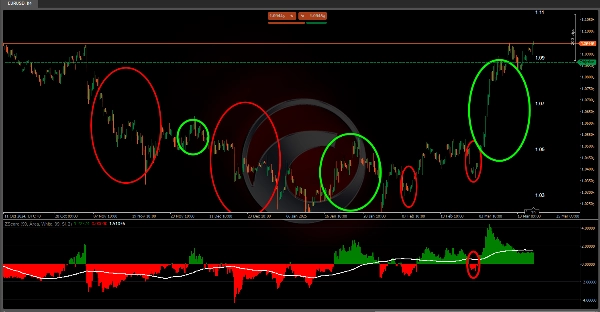
• **Deteksi Ekstrem**: Dengan mengamati nilai yang sangat tinggi atau sangat rendah pada indikator, seorang trader dapat mengidentifikasi bahwa harga telah bergerak jauh dari rata-ratanya. Ini mungkin menunjukkan bahwa koreksi kemungkinan akan terjadi (jika mengharapkan mean reversion) 🔄 atau bahwa breakout kuat sedang berlangsung.
• **Konfirmasi Tren**: Rata-rata bergerak dari Z-Score dan pita terkait memungkinkan Anda melihat perubahan tren perilaku harga relatif terhadap rata-ratanya. Persilangan atau perubahan pada garis-garis ini dapat diartikan sebagai sinyal masuk 🛡️ atau keluar.
• **Manajemen Risiko**: Dengan mengetahui tingkat deviasi dan zona probabilitas, Anda dapat menyesuaikan ukuran posisi atau menentukan titik stop loss ⬇️ dan take profit ⬆️, karena Anda memiliki referensi untuk pergerakan normal versus ekstrem.
• **Pemahaman Statistik tentang Pasar**: Selain hanya sebagai alat grafis, indikator ini mendorong pemikiran tentang perilaku pasar dalam istilah probabilistik. Mengetahui "normalitas" suatu pergerakan dapat menjadi faktor penentu saat mengevaluasi peluang trading. 🎯
🌟 **Kesimpulan** 🌟
Algoritma ini mengubah data harga menjadi representasi statistik yang membantu memvisualisasikan dan mengkuantifikasi penyimpangan harga relatif terhadap perilaku terbarunya. Dengan menggabungkan Z-Score, rata-rata bergerak, pita deviasi, dan tabel probabilitas, indikator ini menyediakan beberapa lapisan informasi. Ini membuatnya sangat berharga untuk mengidentifikasi momen ketika pasar berada dalam kondisi tidak biasa, memudahkan keputusan masuk 🚀, keluar 🛑, dan manajemen risiko berdasarkan probabilitas dan statistik. 📈📉
Indikator Ctrader Store:
Dynamic Market Structure
Analisis Titik Balik
Fibonacci Linear
Regresi Multi-timeframe
Multi-Level Candle Bias
Tracker
Auto Support and
Resistance Trend Lines
Ringkasan
Ulasan pelanggan
5 | 100 % | |
4 | 0 % | |
3 | 0 % | |
2 | 0 % | |
1 | 0 % |


