Deskripsi
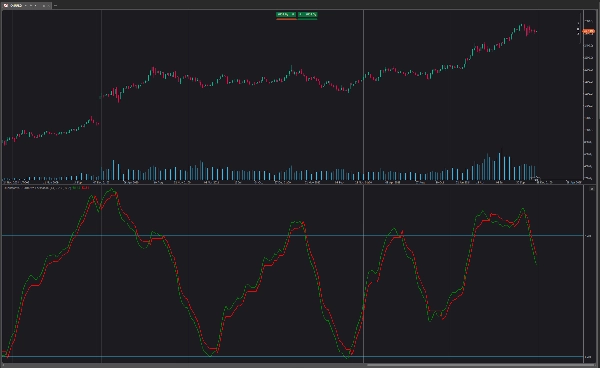
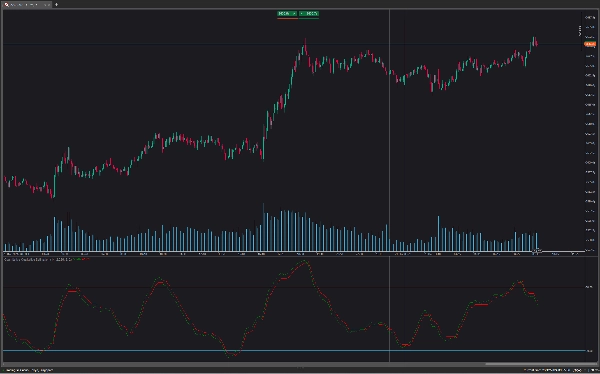
QQE (Quantitative Qualitative Estimation) Weighted Oscillator meningkatkan versi aslinya dengan memberikan bobot pada RSI berdasarkan indikasi yang diberikan oleh trailing stop, membutuhkan lebih banyak usaha agar terjadi persilangan dengan trailing stop. QQE Weighted Oscillator terdiri dari osilator RSI yang dihaluskan dan trailing stop yang berasal dari RSI yang sama.
Osilator ini dapat digunakan untuk menunjukkan apakah pasar jenuh beli/jenuh jual serta sebagai indikasi awal pembalikan tren berkat sifat memimpin dari RSI.
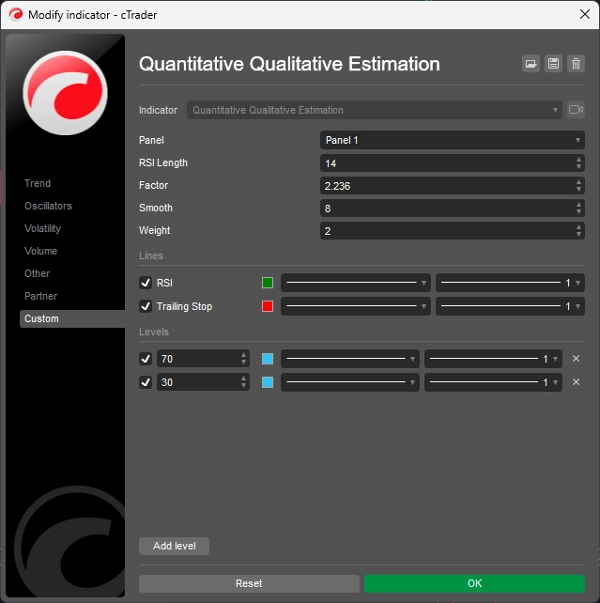
Menggunakan nilai Factor yang lebih tinggi akan menghasilkan trailing stop jangka panjang.
Seperti pada RSI biasa, divergensi dapat menjadi indikasi pembalikan.
Pemberian bobot lebih lanjut akan mengontrol seberapa banyak "usaha" yang diperlukan agar trailing stop melintasi RSI. Misalnya. Misalnya, RSI di atas trailing stop akan membutuhkan variasi harga negatif yang lebih besar agar potensi persilangan terjadi saat menggunakan bobot yang lebih tinggi.
Ini dapat menyebabkan bobot yang lebih tinggi menghasilkan hasil yang lebih siklis dan halus.
Cara mengubah pengaturan:
- Length: Panjang osilator RSI.
- Factor: Faktor perkalian yang digunakan untuk perhitungan trailing stop.
- Smooth: Derajat kehalusan osilator RSI.
- Weight: Derajat pemberian bobot yang digunakan untuk perhitungan RSI.
Ringkasan
Ulasan pelanggan
5 | 100 % | |
4 | 0 % | |
3 | 0 % | |
2 | 0 % | |
1 | 0 % |