
Laguerre RSI
Индикатор
648 скачивания
Версия 1.0, Oct 2024
Windows, Mac
5.0
Отзывы: 1
Описание
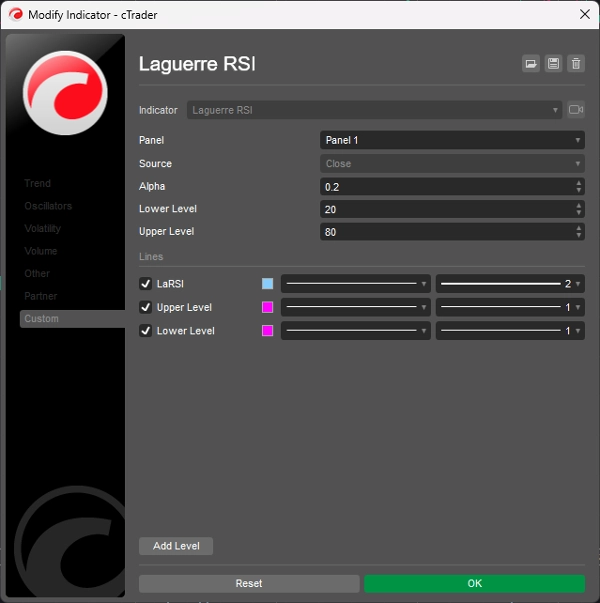
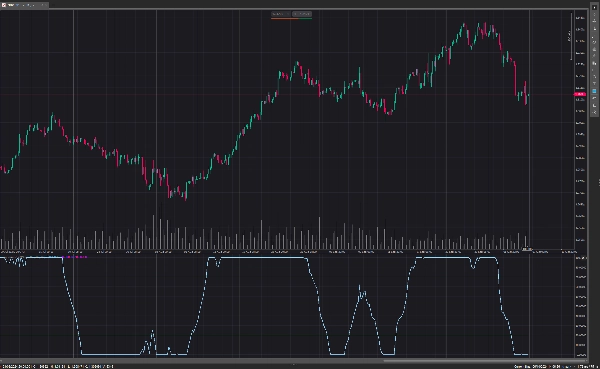
Laguerre RSI основан на фильтре Лагерра Джона Эйлерса для устранения шума RSI.
Изменяйте коэффициент альфа, чтобы увеличить/уменьшить запаздывание и сглаживание.
the
Покупайте, когда Laguerre RSI пересекает уровень 20 снизу вверх.
Продавайте, когда Laguerre RSI пересекает уровень 80 сверху вниз.
Если индикатор держится выше 80 на ровном уровне, восходящий тренд силён.
Если индикатор держится ниже уровня 20 на ровном уровне, это означает, что нисходящий тренд силён.
Сводка
ИИ-сводка
Laguerre RSI is a technical indicator based on John Ehlers' Laguerre Filter designed to reduce the noise commonly found in traditional Relative Strength Index (RSI) calculations. It allows users to adjust the alpha coefficient to control the lag and smoothness of the indicator, tailoring its responsiveness to market conditions. The indicator generates buy signals when the Laguerre RSI crosses upward above the 20 level and sell signals when it crosses downward below the 80 level. Additionally, a flat reading above 80 indicates a strong uptrend, while a flat reading below 20 signals a strong downtrend. This indicator is used to identify trend strength and potential entry and exit points by filtering out market noise inherent in standard RSI measurements.
Профиль индикатора
Отзывы покупателей
5.0
Отзывы: 1
5 | 100 % | |
4 | 0 % | |
3 | 0 % | |
2 | 0 % | |
1 | 0 % |
Отзывы покупателей
July 14, 2025
Pros: Smooths RSI using Laguerre filter, reducing noise and lag. Clear overbought/oversold levels. Great for scalping. Cons: No alerts or tooltips. Requires confirmation with trend filters. Lacks setting templates and advanced features.
Обсуждение
Частые вопросы
RSI
Продукты, доступные в cTrader Store, включая торговых ботов, индикаторы и плагины, предоставляются сторонними разработчиками и доступны исключительно в информационных и технических целях. cTrader Store не является брокером и не предоставляет инвестиционные консультации, персональные рекомендации или какие-либо гарантии будущей доходности.
Больше от этого автора


![Логотип продукта "[Stellar Strategies] Linear Regression Candles 1.1"](https://cdn.ctrader.com/image/webp/8b9cff9f-2431-46d2-b0ec-c7f55f4a4a6d_27918)


Цена
2
Продажи
6.9K
Бесплатные установки