
Deskripsi
Teori Kotak Darvas
Teori Kotak Darvas adalah teknik perdagangan yang dikembangkan oleh Nicolas Darvas pada tahun 1950-an. Ini adalah strategi perdagangan berbasis momentum yang menggunakan aksi harga untuk mengidentifikasi potensi titik masuk dan keluar di pasar.
Cara Kerja Kotak Darvas
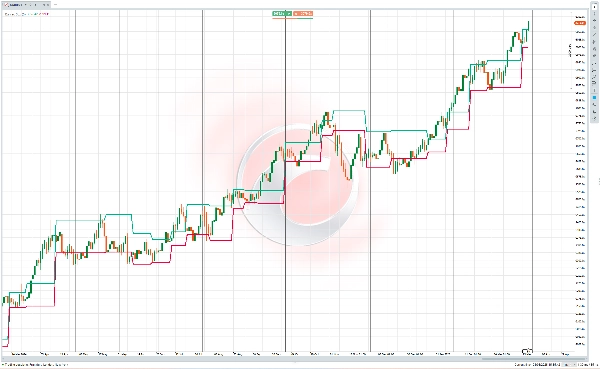
Metode Kotak Darvas melibatkan identifikasi "kotak" atau rentang perdagangan di mana harga saham berkonsolidasi sebelum menembus. Komponen utama meliputi:
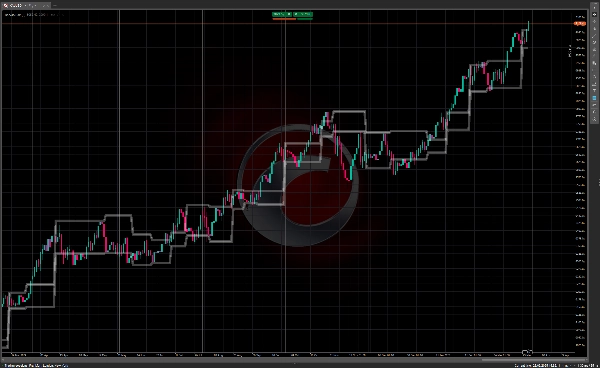
- Harga membentuk rentang perdagangan yang jelas (atau "kotak") dengan batas atas dan bawah yang tegas
- Batas atas mewakili resistensi, sedangkan batas bawah berfungsi sebagai dukungan
- Penembusan di atas kotak menandakan peluang pembelian potensial
- Penurunan di bawah kotak dapat digunakan sebagai sinyal penjualan
Para pedagang yang menggunakan teknik ini biasanya mencari saham yang menunjukkan volume meningkat bersamaan dengan pergerakan harga, karena ini menunjukkan momentum yang lebih kuat di balik penembusan.
Sejarah Teori Kotak Darvas
Nicolas Darvas (1920-1977) adalah sosok yang cukup unik dalam sejarah perdagangan. Lahir di Hungaria, dia bukanlah pedagang profesional berdasarkan pelatihan, melainkan seorang penari yang tampil dalam duo tari ballroom bernama "Darvas dan Julia" bersama saudara tirinya.
Saat tur keliling dunia dengan kelompok tariannya pada tahun 1950-an, Darvas mulai bereksperimen dengan perdagangan saham. Keadaannya unik—dia sering membuat keputusan investasi hanya berdasarkan tabel saham di koran yang dikirimkan kepadanya di berbagai kota selama tur.
Darvas mengembangkan teori kotaknya melalui coba-coba. Awalnya, dia kehilangan uang di pasar tetapi secara bertahap menyempurnakan pendekatannya. Antara tahun 1956 dan 1958, dia dilaporkan mengubah investasi $10.000 menjadi lebih dari $2 juta menggunakan metode kotaknya—prestasi luar biasa yang menarik perhatian.
Pada tahun 1960, Darvas menerbitkan metodenya dalam buku "How I Made $2,000,000 in the Stock Market," yang menjadi klasik dalam literatur perdagangan. Buku tersebut merinci perjalanannya dan menjelaskan teori kotaknya, membawa pendekatan ini ke perhatian publik luas.
Yang membuat metode Darvas sangat menonjol adalah kesederhanaannya dan bahwa metode ini dikembangkan oleh seseorang yang bukan dari industri keuangan. Dia fokus terutama pada aksi harga dan volume daripada analisis fundamental, pendekatan yang agak baru pada waktu itu tetapi sejak itu memengaruhi banyak sistem perdagangan teknis.
Teknik Kotak Darvas tetap populer di kalangan pedagang teknis saat ini, terutama mereka yang mengikuti strategi berbasis momentum di pasar yang sedang tren.


