
Chaikin Money Flow
Indikator
130 unduhan
Versi 1.0, Dec 2024
Windows, Mac
5.0
Ulasan: 1
Deskripsi
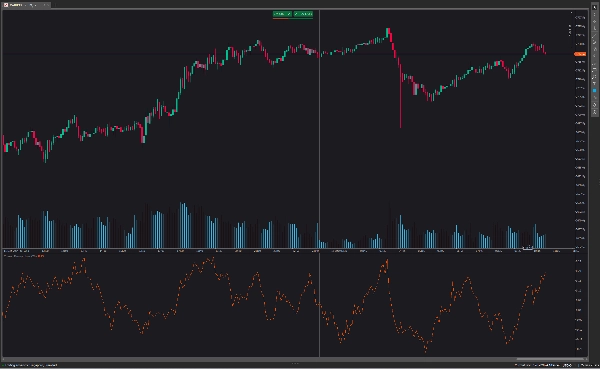
Tujuan utama Chaikin money flow adalah membedakan antara periode akumulasi dan distribusi suatu sekuritas. Ketika indikator berada di atas garis nol, ini menunjukkan sekuritas mengalami akumulasi bersih, yang menyiratkan bahwa investor sedang membeli aset tersebut.
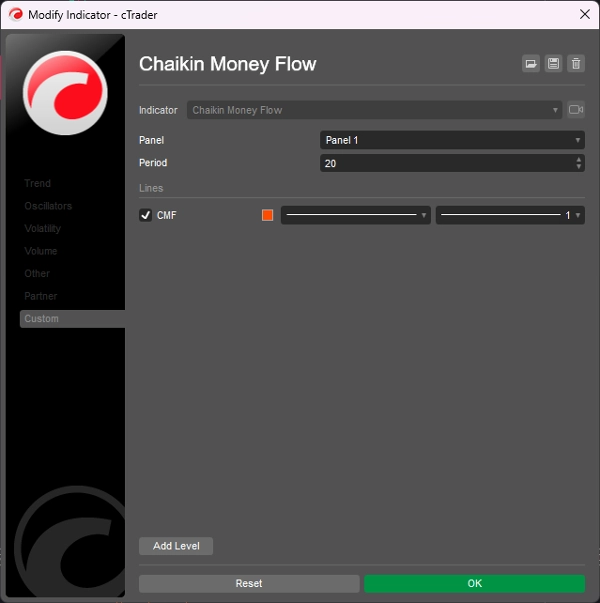
- Pengaturan Chaikin Money Flow dengan nilai di atas 30 membuat indikator kurang sensitif. Ini akan menghasilkan sinyal yang lebih sedikit, tetapi berkualitas lebih baik.
- Pengaturan Chaikin Money Flow dengan nilai di bawah 20 membuat indikator terlalu sensitif. Ini akan menghasilkan lebih banyak kebisingan pasar.
- Ini menunjukkan tren naik yang berkelanjutan ketika indikator CMF melintasi garis nol dari atas dan menghasilkan sinyal beli/jual panjang.
- Ini menunjukkan tren turun yang berkelanjutan ketika indikator CMF melintasi garis nol dari bawah dan menghasilkan sinyal jual/pendek.
Ringkasan
Profil indikator
Ulasan pelanggan
5.0
Ulasan: 1
5 | 100 % | |
4 | 0 % | |
3 | 0 % | |
2 | 0 % | |
1 | 0 % |
Ulasan pelanggan
August 18, 2025
Reliable volume-based trend confirmation, easy to read, customizable period. Cons: No alerts, no MTF analysis, limited filtering options.
Diskusi
Pertanyaan umum
Produk-produk yang tersedia melalui cTrader Store, termasuk bot trading, indikator, dan plugin, disediakan oleh pengembang pihak ketiga serta hanya ditujukan untuk akses teknis dan informasi. cTrader Store bukan broker dan tidak menyediakan saran investasi, rekomendasi pribadi, atau jaminan apa pun tentang kinerja di masa mendatang.
Produk lain dari penulis ini


![Logo "[Stellar Strategies] Visual Trend Momentum"](https://cdn.ctrader.com/image/webp/48aee0a5-f10e-4bc8-9671-78e156fcc5df_27548)


Harga
2
Penjualan
6.89K
Instal gratis