
Deskripsi
EMAScalpHistogram: Visualisasi Momentum untuk Manajemen Perdagangan
Apa itu EMAScalpHistogram?
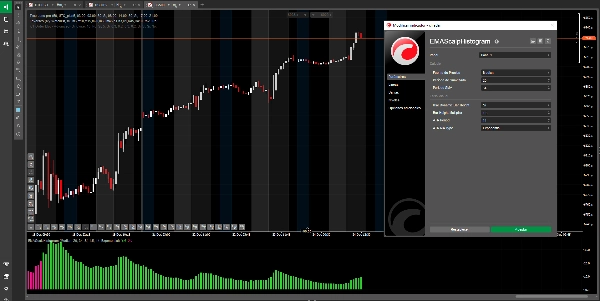
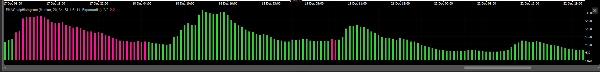
EMAScalpHistogram adalah alat analisis teknis canggih yang mengubah kompleksitas momentum pasar menjadi histogram yang intuitif dan menarik secara visual. Desainnya memungkinkan identifikasi kekuatan dan arah tren hanya dengan sekali lihat.
- Batang Hijau (Bullish): Menunjukkan momentum pembelian yang kuat, menunjukkan bahwa pembeli mengendalikan pasar.
- Batang Merah Muda (Bearish): Menunjukkan momentum penjualan yang kuat, menunjukkan bahwa penjual mendominasi aksi harga.
- Tinggi Dinamis: Tinggi batang tidak tetap; menyesuaikan dengan volatilitas pasar. Batang yang lebih tinggi menandakan pergerakan dengan kekuatan dan keyakinan lebih, sementara batang yang lebih pendek menunjukkan jeda atau tren yang melemah.
Penggunaan Utama dan Strategi yang Direkomendasikan
EMAScalpHistogram adalah alat manajemen perdagangan elit, dirancang untuk trader yang ingin memaksimalkan keuntungan dengan memegang posisi dengan lebih percaya diri. Nilai terbesarnya adalah membantu Anda mempertahankan dan memperbesar keuntungan Anda setelah Anda sudah berada dalam perdagangan.
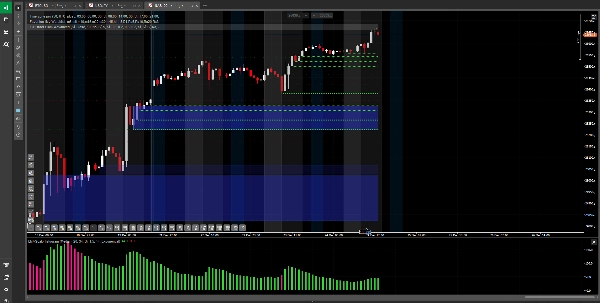
- Konfirmasi Tren: Fungsi terkuatnya adalah memvalidasi kekuatan tren yang sudah Anda identifikasi. Jika Anda berada dalam posisi beli dan histogram secara konsisten menunjukkan batang hijau, itu adalah konfirmasi visual bahwa momentum pembelian tetap utuh.
- Manajemen Perdagangan (Memegang dan Memperbesar Keuntungan):
-
- Untuk Memegang Posisi: Ini adalah aplikasi paling berharga. Gunakan untuk memutuskan kapan harus memegang posisi dengan percaya diri. Jika histogram terus menunjukkan batang yang menguntungkan Anda, ini memberi Anda disiplin untuk tidak menutup perdagangan yang menguntungkan terlalu dini karena fluktuasi pasar kecil.
- Untuk Memperbesar Keuntungan: Dengan membantu Anda memegang posisi selama fase momentum kuat secara keseluruhan, ini memungkinkan Anda menangkap pergerakan yang lebih besar dan memperbesar potensi keuntungan Anda.
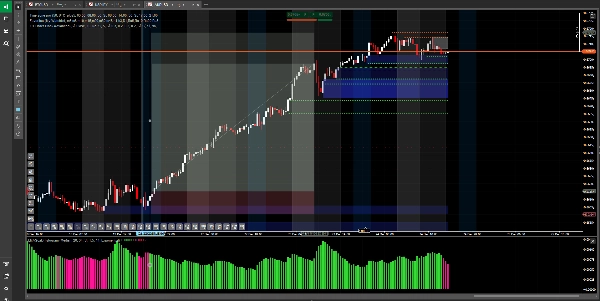
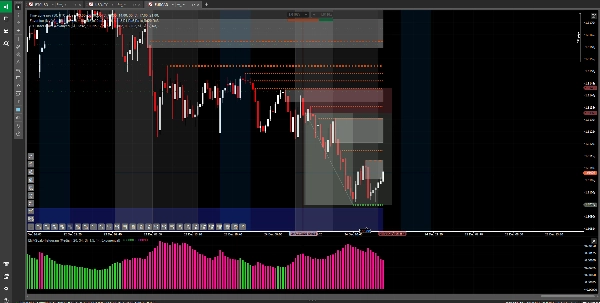
- Peringatan untuk Momentum yang Melemah: Perubahan warna histogram (dari hijau ke merah muda atau sebaliknya) adalah salah satu peringatan pertama bahwa momentum mulai habis, menunjukkan mungkin saat yang tepat untuk mengamankan keuntungan atau menyesuaikan strategi keluar Anda.
Hal yang Harus Dihindari
Bukan Sinyal Masuk: Secara kritis, EMAScalpHistogram tidak dirancang untuk digunakan sebagai sinyal mandiri untuk membuka perdagangan baru. Sebagai indikator yang mengonfirmasi kekuatan pergerakan yang sudah berlangsung, menggunakannya untuk masuk dapat mengakibatkan perdagangan terlambat dengan risiko tinggi dan potensi keuntungan terbatas.
Peringatan Risiko dan Penafian
Penggunaan indikator ini adalah atas risiko dan tanggung jawab Anda sendiri. Perdagangan instrumen keuangan membawa tingkat risiko tinggi dan mungkin tidak cocok untuk semua investor. Alat ini tidak merupakan rekomendasi investasi atau nasihat keuangan. Kinerja masa lalu bukan jaminan hasil di masa depan. Sangat disarankan untuk menguji strategi apa pun pada akun demo sebelum mempertaruhkan modal nyata.
Ringkasan
Ulasan pelanggan
5 | 67 % | |
4 | 33 % | |
3 | 0 % | |
2 | 0 % | |
1 | 0 % |


