
Deskripsi
🚀 Sistem Breakout Saluran
Algoritma khusus ini dirancang untuk mengonfirmasi titik masuk dan keluar dengan presisi 🎯 dengan menggabungkan beberapa elemen analisis teknikal untuk memberikan sinyal yang dapat diandalkan.
🔍 Bagaimana Cara Kerjanya?
📊 Saluran Berbasis Volatilitas (ATR)
✅ Volatilitas pasar dihitung menggunakan ATR (Average True Range) 📉.
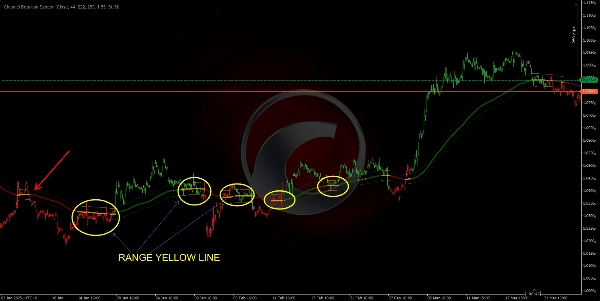
✅ "Trend MA" disesuaikan dengan menambahkan dan mengurangi nilai yang proporsional dengan volatilitas ini, membentuk dua garis putus-putus yang berfungsi sebagai "langit-langit" dan "lantai" pasar.
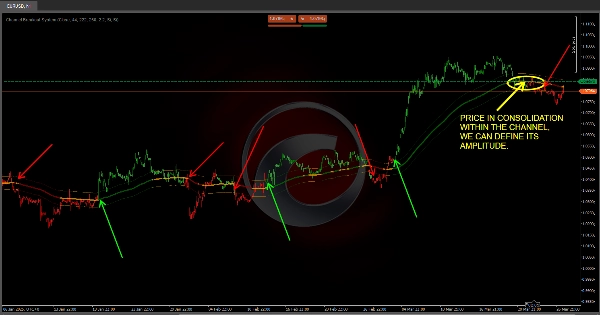
✅ Apa artinya ini untuk Anda? Jika harga tetap dalam saluran, pasar mungkin sedang dalam fase ranging atau konsolidasi; jika jelas breakout, itu adalah sinyal pergerakan tren yang kuat 📈📉.
✅ Sepenuhnya dapat disesuaikan! Sesuaikan pengaturan saluran agar sesuai dengan strategi Anda 📌.
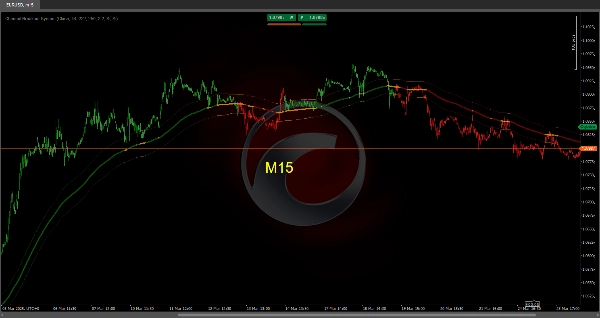
🟢 Deteksi Tren dengan Warna Pintar
🔹 Indikator membandingkan posisi fast MA dengan medium MA, dan keduanya terhadap Trend MA.
🔹 Berdasarkan fase pasar, lilin berubah warna:
- 🟢 Hijau → Fase pasar bullish.
- 🔴 Merah → Fase pasar bearish.
- 🟠 Oranye atau netral → Kemungkinan konsolidasi atau ketidakpastian.
🔹 Jika harga dan rata-rata bergerak "terjebak" di dalam saluran, itu menandakan fase konsolidasi, membantu Anda menghindari perdagangan di zona yang tidak pasti.
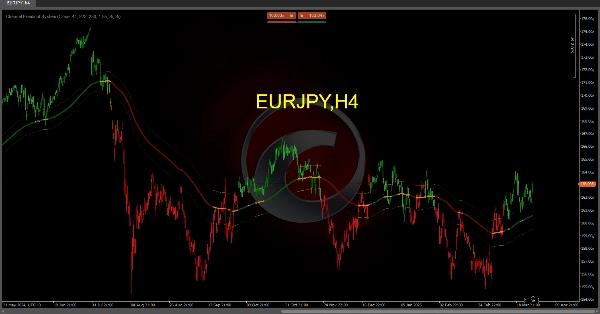
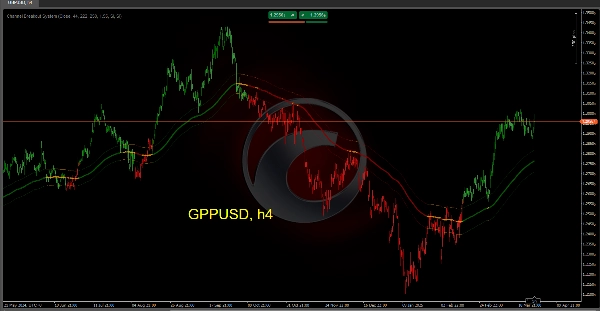
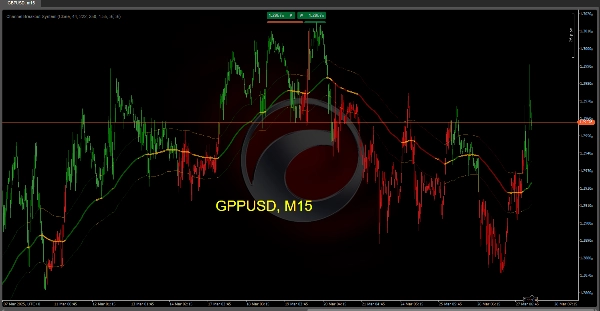
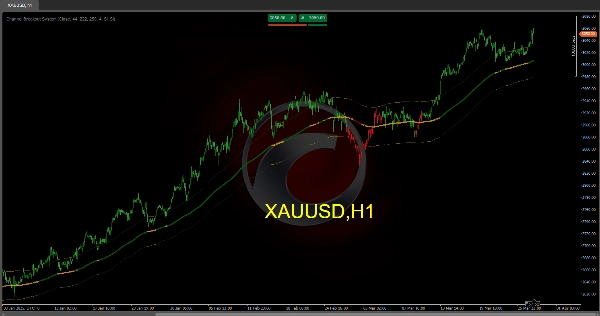
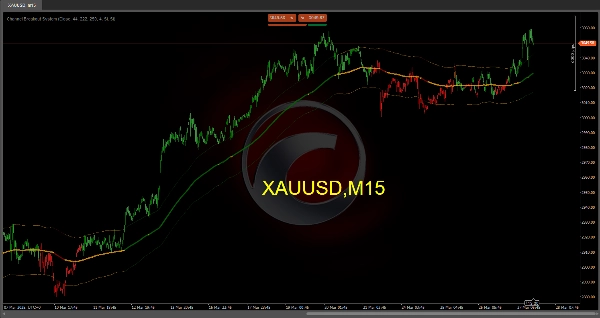
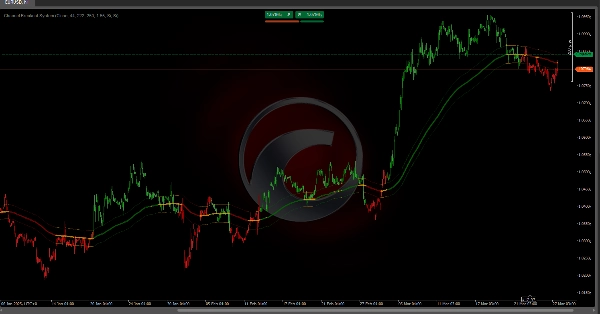
🎯 Bagaimana Tampilan di Grafik
🔵 Garis tren utama: Berubah warna tergantung arah pasar (hijau, merah, atau oranye).
📏 Saluran putus-putus: Mencerminkan rentang pasar berdasarkan volatilitas.
📊 Batang berwarna: Memberikan representasi visual yang mudah dari fase pasar saat ini.
🚀 Mengapa Menggunakan Sistem Ini?
✔ Cepat mengidentifikasi apakah pasar sedang tren atau ranging.
✔ Menyoroti secara visual kekuatan dan arah tren.
✔ Mengantisipasi potensi pembalikan dengan sinyal breakout dan crossover yang jelas.
✔ Mengonfirmasi titik masuk dan keluar, mengurangi sinyal palsu dan meningkatkan akurasi perdagangan.
🔹 Optimalkan perdagangan Anda dan beroperasi dengan kepercayaan lebih besar menggunakan Sistem Breakout Saluran 🏆. Bersiaplah untuk menemukan peluang pasar terbaik! 📈🔥
Indikator Ctrader Store:
Dynamic Market Structure
Analisis Titik Balik
Fibonacci Linear
Regresi Multi-timeframe
Multi-Level Candle Bias
Tracker
Auto Support and
Resistance Trend Lines
All Support and
Resistance Levels
Ringkasan
Ulasan pelanggan
5 | 33 % | |
4 | 67 % | |
3 | 0 % | |
2 | 0 % | |
1 | 0 % |


