
Descrizione
🏆 Oltre 10.000 trader si affidano alla nostra suite di oltre 25 algoritmi! 🏆
Da Market Structure & Liquidity a Smart Exit Systems & Predictive Tools - abbiamo costruito OGNI strumento di cui hai bisogno per la coerenza.
👉 Accedi a tutti i 25+ sistemi PROVATI:
_______________________________________________
📌 Indicatori di Market Structure
· ✅ AdvancedMarket Structure: Bos, Choch, SwinLevels, Order Blocks, Market Structure& Liquidity Finder
· 🔄 Analisi dinamica della Market Structure dei punti di svolta
· 🧱 Order Block
· ⚖️ Market Imbalance
· ⛓️ BOS & CHOCH
· 🧠 ICT Power of 3
_______________________________________________
🔚 Sistemi di uscita intelligenti
· 📍 Algoritmo intelligente trailing
_______________________________________________
📐 Indicatori ZigZag
· 🔍 Proiezione della liquidità del prezzo ZigZag
· ➖ ZigZag
· 🎯 Tracciatore di estremi Zig-Zag
_______________________________________________
🧱 Indicatori di supporto e resistenza
· 🟩 Linee di supporto e resistenza SmartTrend
· 🧱 Tutti i livelli di supporto e resistenza
_______________________________________________
📊 Indicatori di trend e canale
· 🔄 Canale di tendenza automatico
· 📊 Supertrend
· ⚡Analizzatore di trend Momentum
· 🧠 Canale di tendenza adattivo
· 💥 Sistema di breakout del canale
· 🌈 Gradiente di tendenza dinamico
_______________________________________________
💧 Strumenti di volume e liquidità
· 🔥 Mappa di calore Volume POC
· 📉 Mappa di liquidazione della leva
_______________________________________________
⚡ Indicatori Momentum e RSI
· 🚀 Momentum a intervallo dinamico
· 🔎 Bias a più livelli delle candele
Tracker
_______________________________________________
🔮 Strumenti di previsione e proiezione
· 📐 Previsione basata su Linreg& ATR
· 📏 Regressione lineare di FibonacciMulti-timeframe
· 📈 Proiettore di flusso di mercato alimentato dal volume_________________________
_________________________________________________________________________________________________
_________________________________________________________________________________________________
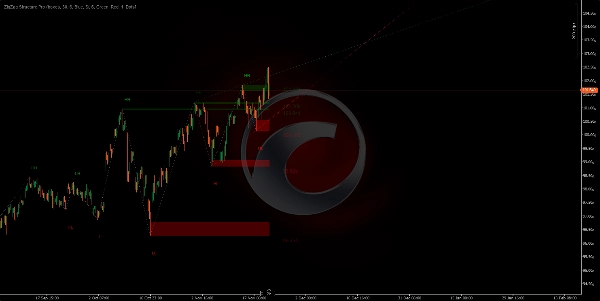
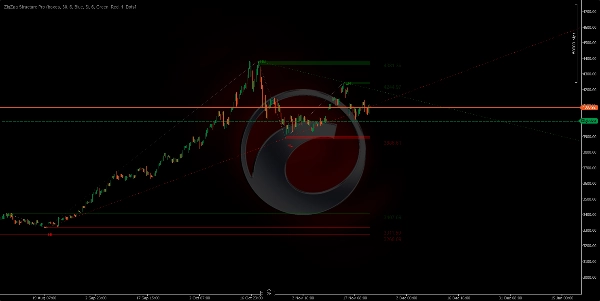
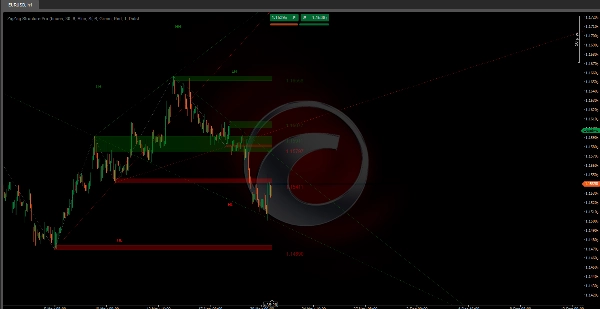
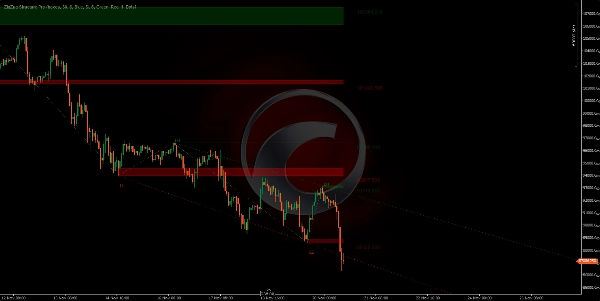
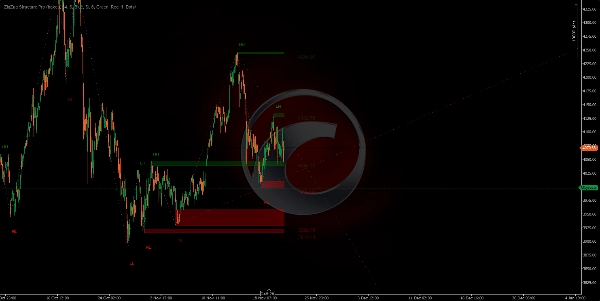
ZigZag Structure Pro – 🚀
Identifica automaticamente i punti di svolta significativi del mercato (massimi e minimi chiave) e disegna zone dinamiche di supporto e resistenza che si aggiornano in tempo reale. 🎯 A differenza dei livelli statici tradizionali, questo indicatore si adatta costantemente alla struttura dei prezzi in evoluzione.
A cosa serve? ❓
Questo indicatore è uno strumento professionale di analisi tecnica progettato per:
- Identificare i livelli istituzionali: 🏛️ Rileva automaticamente i punti in cui il prezzo ha formato strutture importanti di massimi e minimi.
- Analisi della struttura di mercato: 📊 Classifica ogni movimento secondo la metodologia della struttura rialzista/ribassista (Higher Highs, Lower Lows, ecc.).
- Proiezione del trend: 🔮 Estende le linee di tendenza nel futuro per anticipare potenziali zone di reazione del prezzo.
- Trading di inversioni e continuazioni: 💰 I livelli segnati servono come riferimento per ingressi, stop-loss e obiettivi di profitto.
L'indicatore disegna sul tuo grafico: ✍️
1. Zone di supporto/resistenza (rettangoli)
- Zone verdi: 🟢 Segnano aree di supporto (minimi significativi dove il prezzo potrebbe rimbalzare).
- Zone rosse: 🔴 Segnano aree di resistenza (massimi significativi dove il prezzo potrebbe ritirarsi).
- Queste zone sono proiettate in avanti, mostrando i livelli attivi correnti.
- Lo spessore di ogni zona rappresenta il corpo della candela in cui si è formato il pivot.
https://chartshots.spotware.com/c/691f5a4d75ac4
https://chartshots.spotware.com/c/691f6b4f2e98b
https://chartshots.spotware.com/c/691f6c6fda808
https://chartshots.spotware.com/c/691f6d0aa6155
2. Linee di connessione ⚡
- Collega ogni pivot con il successivo, creando un modello visivo a "zigzag".
- Elimina il rumore di mercato, mostrando solo i movimenti veramente significativi.
- Rende facile vedere la direzione e la struttura del trend a colpo d'occhio.
3. Linee di tendenza proiettate (Verde/Rosso estese)
- Tracciate dal pivot precedente a quello attuale e prolungate nel futuro.
- Verde: 🟢 Linee di tendenza rialziste (da minimi).
- Rosso: 🔴 Linee di tendenza ribassiste (da massimi).
- Mostra le 2 linee di tendenza più recenti e attive.
- Utile per rilevare rotture o rispetto del trend.
4. Etichette della struttura di mercato 🏷️
Ogni pivot mostra un'etichetta che indica la sua classificazione:
- HH (Higher High): ↗️ Massimo più alto - Continuazione rialzista.
- LH (Lower High): ⬆️ Massimo più basso - Possibile inversione ribassista.
- HL (Higher Low): ⬇️ Minimo più alto - Possibile inversione rialzista.
- LL (Lower Low): ↘️ Minimo più basso - Continuazione ribassista.
Logica dietro l'algoritmo 🧠
L'indicatore utilizza un algoritmo zigzag adattivo che:
- Scansiona il prezzo alla ricerca di massimi e minimi entro un periodo configurabile (default 34 barre).
- Filtra i movimenti insignificanti attraverso una soglia minima di deviazione (default 6 pips).
- Valida ogni pivot assicurandosi che rappresenti un reale cambiamento nella struttura di mercato.
- Confronta le strutture tra pivot consecutivi per classificare il tipo di movimento.
- Aggiorna dinamicamente le zone man mano che appaiono nuovi pivot, rimuovendo i più vecchi.
Impostazioni principali ⚙️
- Barre di lookback del pivot: Controlla la sensibilità del rilevatore di pivot (più basso = più pivot, più alto = solo pivot principali).
- Filtro di deviazione del prezzo: Filtro del rumore - i movimenti inferiori a questo valore vengono ignorati.
- Numero massimo di zone visibili: Numero di livelli storici che rimangono visibili (da 1 a 20).
- Tipo di visualizzazione della zona: Scegli tra rettangoli (zone complete) o linee semplici.
- Mostra linee di tendenza estese: Attiva/disattiva le proiezioni di trend.
Guida rapida ai parametri 📖
Barre di lookback del pivot (Default: 30)
- ↑ Aumenta (40-100): MENO pivot, più importanti. Per swing trading.
- ↓ Diminuisci (15-25): PIÙ pivot, più segnali. Per scalping/day trading.
Filtro di deviazione del prezzo (Default: 6)
- ↑ Aumenta (8-15): Filtra il rumore, solo movimenti grandi. Meno segnali, qualità superiore.
- ↓ Diminuisci (2-5): Più sensibile, cattura piccoli movimenti. Più segnali.
Numero massimo di zone visibili (Default: 6)
- ↑ Aumenta (10-20): Più livelli storici visibili. Per analisi approfondite.
- ↓ Diminuisci (2-4): Solo livelli recenti. Grafico pulito.
Limite storico dei pivot (Default: 200)
- ↑ Aumenta (300-500): Più storia per i calcoli. Analisi a lungo termine.
- ↓ Diminuisci (50-150): Solo struttura recente. Migliore performance.
Conteggio delle proiezioni attive (Default: 5)
- ↑ Aumenta (5-10): Più linee di tendenza proiettate.
- ↓ Diminuisci (1-2): Solo trend dominanti. Più chiarezza.
Mostra linee di tendenza estese (Sì/No)
- Abilitato: Proietta i trend nel futuro.
- Disabilitato: Solo zigzag storico.
🎯 Configurazioni rapide
- Scalping: Lookback 15-20 | Deviazione 3-5 | Zone 3-4
- Day Trading: Lookback 25-35 | Deviazione 6-8 | Zone 5-6
- Swing Trading: Lookback 40-60 | Deviazione 10-15 | Zone 8-12
Riepilogo
Recensioni dei clienti
5 | 0 % | |
4 | 100 % | |
3 | 0 % | |
2 | 0 % | |
1 | 0 % |


![Logo di "[Hamster-Coder] Bollinger Bands"](https://cdn.ctrader.com/image/webp/21d8e5d6-fb11-4bac-b9ee-cd05c2b76804_30327)


