OR Session Zones
Indikator
Versi 1.1, Dec 2025
Windows, Mac
4.5
Ulasan: 2
Deskripsi
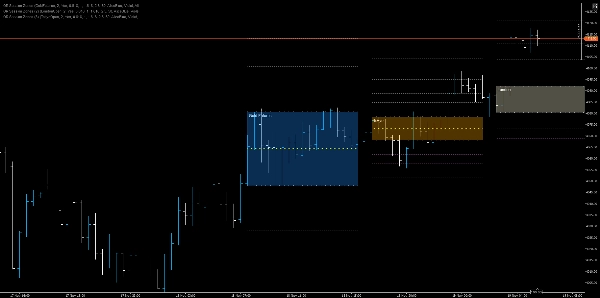
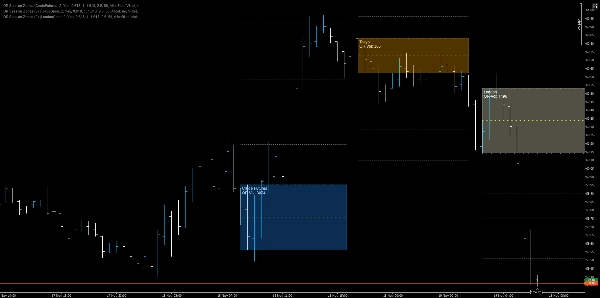
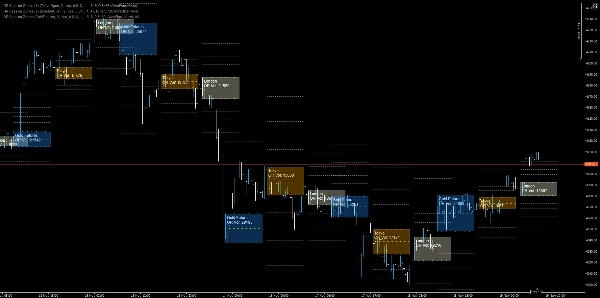
Zona Sesi OR — Indikator Multi-Sesi Opening Range
Indikator Opening Range presisi tinggi yang mendeteksi pembukaan sesi (NY, London, EU, Tokyo, Shanghai, futures Emas/Minyak mentah), menggambar zona OR tinggi/rendah/tengah dinamis, memproyeksikan target berbasis Fibonacci, dan melukis area bayangan yang dapat dikonfigurasi untuk pengambilan keputusan visual cepat.
Fitur utama
- Deteksi multi-sesi: Dukungan asli untuk bar pembukaan New York, London, EuroNext, Tokyo, Shanghai, Futures Emas, dan Futures Minyak Mentah menggunakan indikator sesi khusus.
- Perhitungan Opening Range: Menghitung OR High dan OR Low dari jumlah candle yang dapat dikonfigurasi (RangeCandles) dan mencatat waktu mulai sesi.
- Overlay grafik yang persisten: Menggambar garis tren untuk OR High, OR Low, dan OR Mid (50%) di seluruh grafik hingga waktu perpanjangan yang dapat dikonfigurasi.
- Zona bayangan: Persegi panjang terisi antara OR High dan OR Low dengan opasitas dan warna yang dapat dikonfigurasi per sesi untuk konteks visual instan.
- Proyeksi Fibonacci: Hingga empat garis proyeksi R (resistensi) dan S (dukungan) yang berasal dari rentang OR dengan warna independen dan opasitas yang dapat disesuaikan.
- Visibilitas fleksibel: Opsi untuk menyembunyikan atau merender ID objek terindeks (unik) untuk mencegah tabrakan; mendukung objek persisten tunggal dan objek per-bar saat Hide diaktifkan.
- Pengkodean warna sesi: Setiap sesi menggunakan skema warna berbeda (misalnya, DodgerBlue, LightYellow, Orange, OrangeRed) untuk membuat asal sesi langsung jelas.
Bagaimana ini membantu trader
- Konteks cepat: Langsung lihat di mana pasar dibuka untuk sesi utama dan pahami struktur rentang awal tanpa pengukuran manual.
- Pemicu keputusan: Gunakan break OR, penolakan garis tengah, dan proyeksi Fibonacci sebagai aturan masuk/keluar atau jangkar penempatan stop.
- Strategi multi-sesi: Gabungkan OR yang tumpang tindih (misalnya, London + NY) untuk mendeteksi zona konfluensi sesi dan area perdagangan dengan probabilitas lebih tinggi.
- Manajemen risiko: Tempatkan stop di belakang tumpukan OR atau gunakan tengah 50% sebagai target stop/take dinamis.
Skenario penggunaan dan aturan contoh
- Entry breakout: Beli saat penutupan di atas OR High dengan konfirmasi dari volume atau momentum; stop tepat di bawah OR High (atau OR Mid untuk exit yang lebih ketat).
- Fade pembukaan: Jual dekat OR High dengan konfirmasi pembalikan jika harga gagal bertahan di atas OR Mid dan menunjukkan penarikan cepat dari tawaran.
- Perdagangan konfluensi sesi: Ketika OR London dan NY tumpang tindih, anggap tumpang tindih tersebut sebagai zona pasokan/permintaan dengan kepercayaan tinggi dan sesuaikan ukuran posisi sesuai.
- Target proyeksi: Gunakan R1/R2/R3/R4 sebagai level take-profit bertahap dan S1 - S4 secara simetris untuk target penurunan.
Ringkasan
Profil indikator
Ulasan pelanggan
4.5
Ulasan: 2
5 | 50 % | |
4 | 50 % | |
3 | 0 % | |
2 | 0 % | |
1 | 0 % |
Ulasan pelanggan
November 22, 2025
Solid enough as a backup opinion, and It can look better than it is during a lucky run.
November 19, 2025
Diskusi
Pertanyaan umum
Fibonacci
Forex
Breakout
Indices
EURUSD
Commodities
GBPUSD
XAUUSD
NAS100
Produk-produk yang tersedia melalui cTrader Store, termasuk bot trading, indikator, dan plugin, disediakan oleh pengembang pihak ketiga serta hanya ditujukan untuk akses teknis dan informasi. cTrader Store bukan broker dan tidak menyediakan saran investasi, rekomendasi pribadi, atau jaminan apa pun tentang kinerja di masa mendatang.


![Logo "[Hamster-Coder] Bollinger Bands"](https://cdn.ctrader.com/image/webp/21d8e5d6-fb11-4bac-b9ee-cd05c2b76804_30327)


Harga
26
Penjualan
2.15K
Instal gratis