
Deskripsi
Trend Scope Pro adalah indikator teknis tingkat profesional yang dirancang untuk memberikan pemahaman yang lebih dalam kepada para trader tentang struktur pasar dan arah harga. Dibangun berdasarkan algoritma regresi linier canggih, alat ini menghitung garis regresi dinamis bersama dengan tiga tingkat saluran deviasi standar. Dengan menggabungkan akurasi statistik dengan kejelasan visual, alat ini membantu Anda mengidentifikasi tren pasar saat ini, zona pembalikan potensial, dan rentang volatilitas dengan mudah, menjadikannya tambahan yang mudah diakses namun kuat untuk setiap alat trading.
Cara Membaca Trend Scope Pro
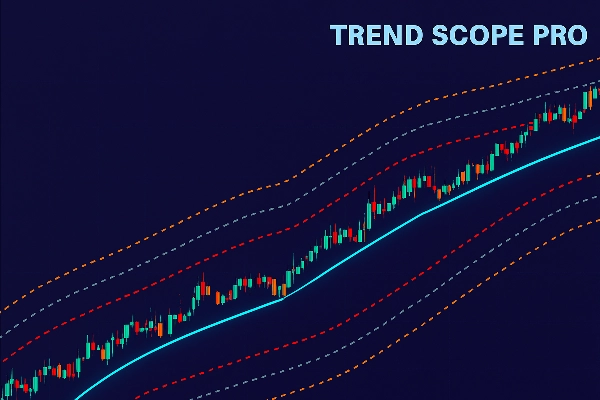
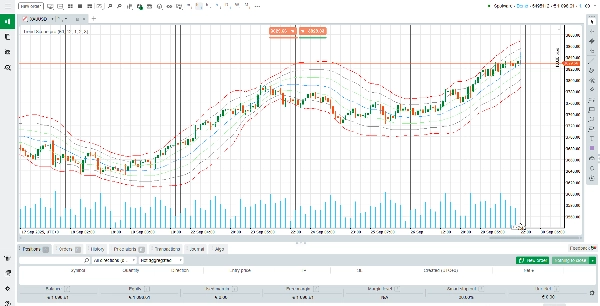
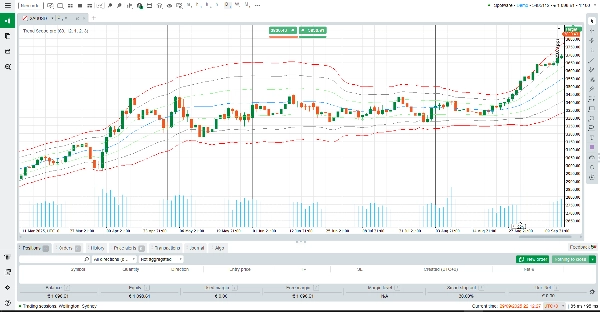
Saat diterapkan pada grafik Anda, Trend Scope Pro menggambar garis regresi tengah (biru), yang mewakili “nilai wajar” atau arah tren rata-rata selama periode tertentu. Di sekitar garis ini, tiga set saluran atas dan bawah digambar (oranye, abu-abu, dan merah). Setiap saluran dihitung menggunakan pengali deviasi standar yang berbeda:
Atas/Bawah 1 (Oranye): Mewakili deviasi standar pertama. Pergerakan harga dalam zona ini sering mencerminkan volatilitas jangka pendek yang normal.
Atas/Bawah 2 (Abu-abu): Menandai deviasi yang lebih kuat. Mencapai zona ini sering menandakan pergerakan yang diperpanjang atau momentum yang berkembang.
Atas/Bawah 3 (Merah): Zona ekstrem di mana pasar mungkin overbought atau oversold, menciptakan peluang pembalikan potensial.
Dalam praktiknya, trader dapat menggunakan garis regresi untuk mengonfirmasi arah tren, sementara saluran bertindak sebagai level support dan resistance dinamis. Contohnya:
Jika harga secara konsisten berada di atas garis regresi, trennya bullish.
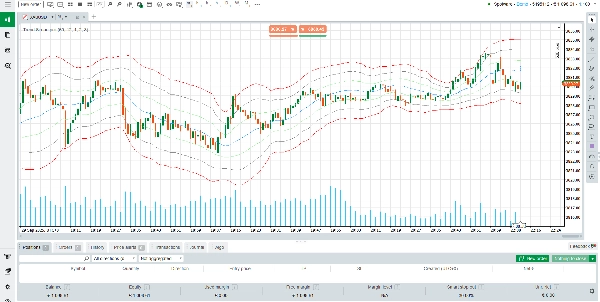
Jika harga berulang kali menguji atau menembus di bawah garis regresi, trennya melemah.
Sentuhan ekstrem pada saluran merah dapat menyoroti titik kelelahan, di mana pembalikan atau penarikan kembali lebih mungkin terjadi.
Cara Kerja Indikator
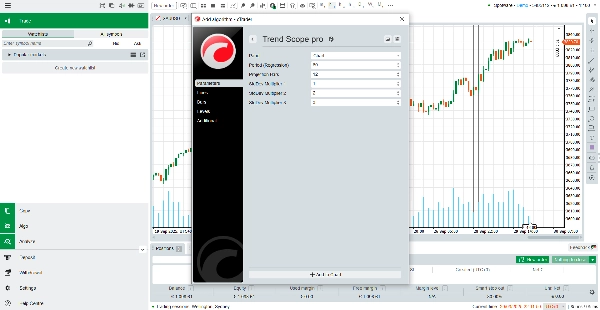
Trend Scope Pro menghitung garis regresi dengan menganalisis harga penutupan selama periode lookback yang dipilih. Kemudian mengukur deviasi standar harga dari garis ini, yang menentukan lebar setiap saluran. Pendekatan statistik ini memastikan indikator menyesuaikan dengan volatilitas waktu nyata, memberikan keseimbangan antara sinyal mengikuti tren dan wawasan mean-reversion.
Pengaturan default (60 bar lookback, pengali 1.0, 2.0, 3.0) dioptimalkan untuk sebagian besar instrumen, tetapi Anda dapat dengan mudah menyesuaikannya agar sesuai dengan strategi atau kerangka waktu Anda. Baik Anda seorang day trader yang mencari entri intraday, atau swing trader yang menganalisis siklus pasar yang lebih luas, Trend Scope Pro memberikan konteks yang dapat diandalkan untuk pengambilan keputusan.
Fitur Utama Trend Scope Pro
Regresi Linier Adaptif – Menghitung tren pasar tengah secara dinamis untuk bias arah yang tepat.
Saluran Multi-Level – Tiga set pita deviasi membantu mengidentifikasi pergerakan normal, tren kuat, dan kondisi ekstrem.
Kejelasan Visual – Garis yang bersih dan berwarna memudahkan interpretasi aksi harga secara sekilas.
Pengaturan yang Dapat Disesuaikan – Periode lookback dan pengali deviasi yang fleksibel untuk menyesuaikan dengan gaya trading apa pun.
Singkatnya, Trend Scope Pro menggabungkan keandalan statistik dengan kegunaan praktis. Ini lebih dari sekadar garis tren—ini adalah kerangka kerja lengkap untuk menganalisis perilaku harga, mengidentifikasi zona probabilitas tinggi, dan meningkatkan timing trading. Baik Anda mencari konfirmasi tren, mengantisipasi pembalikan, atau sekadar menambahkan struktur pada grafik Anda, Trend Scope Pro menawarkan kejelasan dan kepercayaan yang Anda butuhkan.
Ringkasan
Ulasan pelanggan
5 | 50 % | |
4 | 50 % | |
3 | 0 % | |
2 | 0 % | |
1 | 0 % |


