
trPDHLC
Gösterge
1 satın almalar
Sürüm 1.0, Mar 2025
Windows, Mac
Açıklama
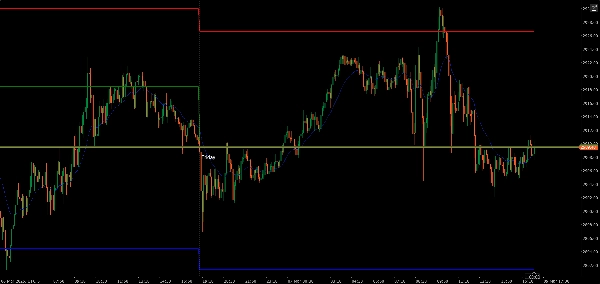
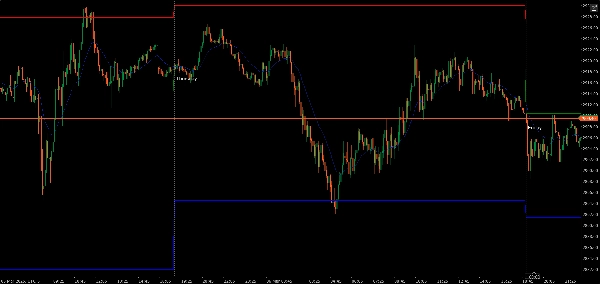
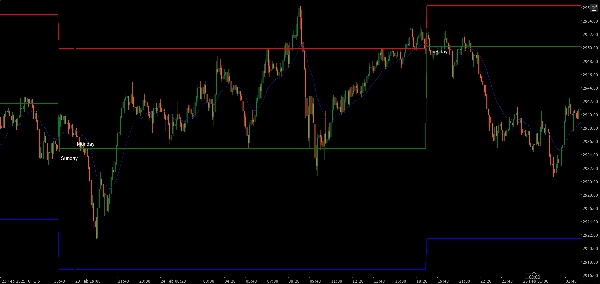
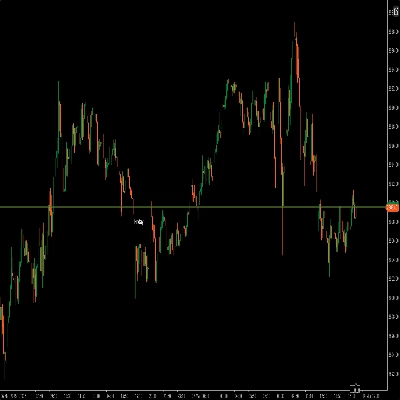
önceki günün yüksek, düşük ve kapanış göstergesi.
mavi çizgi önceki günün düşüğünü gösterir.
kırmızı çizgi önceki günün yüksek seviyesini gösterir.
yeşil çizgi önceki günün kapanışını gösterir.
Özet
YZ özeti
The trPDHLC indicator displays the previous day's high, low, and closing prices on a trading chart. It uses color-coded lines for clear visualization: a red line marks the previous day's high, a blue line indicates the previous day's low, and a green line shows the previous day's closing price. This tool helps traders quickly reference key price levels from the prior trading day, aiding in technical analysis and decision-making. The indicator is tagged for use with indices markets.
Gösterge profili
Müşteri değerlendirmeleri
0.0
Değerlendirmeler: 0
Müşteri değerlendirmeleri
Bu ürün için henüz bir değerlendirme yok. Ürünü denediniz mi? O zaman ona dair görüşlerini paylaşan ilk kişi olun!
Tartışma
SSS
Indices
cTrader Store üzerinden erişilebilen işlem botları, göstergeler ve eklentiler gibi ürünler, üçüncü taraf sağlayıcılar tarafından sağlanır ve yalnızca bilgilendirme ve teknik erişim amaçlarıyla sunulur. cTrader Store bir broker değildir ve yatırım tavsiyesi, kişisel öneriler vermez veya gelecekteki performansı garanti etmez.
Bu oluşturanın diğer ürünleri


Fiyat
Başlangıç 08/03/2025
1
Satışlar