説明
チャートの離脱なしでのズーム、時間枠、チャート設定による高速ナビゲーションのためのチャートコントロールパネル。
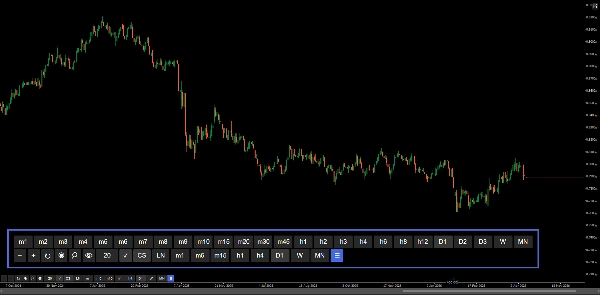
ズームプリセット、手動ズーム入力、全時間枠およびチャートセレクター、設定可能なお気に入り時間枠、期間区切り、丸数字グリッド、ライブの買値/売値ライン — すべてチャート上のUIボタンからアクセス可能。アクティブな取引セッション中にcTraderのネイティブメニューのナビゲーションに費やす時間を削減するために設計されています。
機能
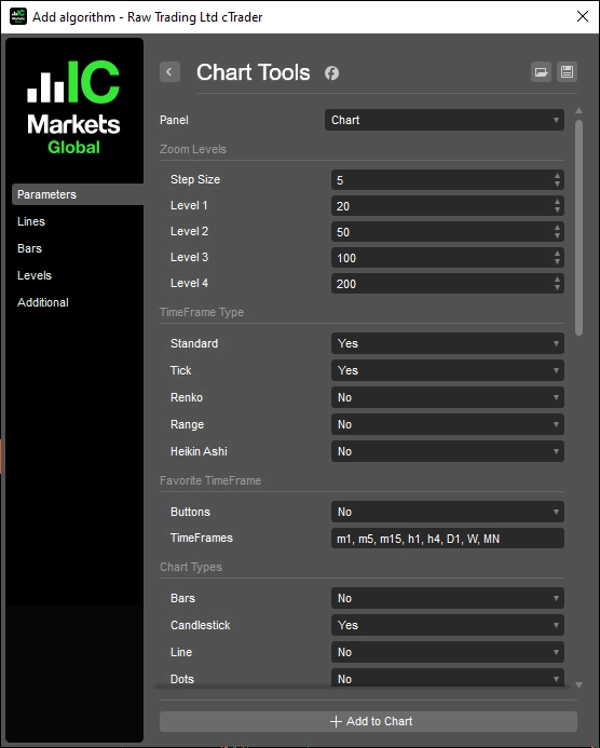
ズームコントロール
- 設定可能なステップサイズでズームイン/ズームアウト
- ワンクリックアクセス用の4つの設定可能なプリセットズームレベル
- 適用ボタン付きの手動ズーム入力
- cTraderのネイティブズームイベントと同期
時間枠セレクター
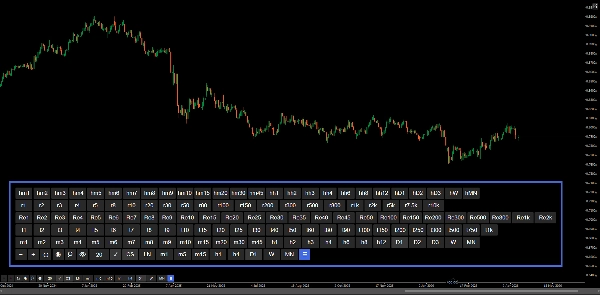
- 標準、ヘイキンアシ、レンコ、レンジ、ティックのすべての時間枠タイプをカバーするフルボタンパネル
- すべてのモードで各タイプを別々の行として表示
- アクティブな時間枠は自動的にハイライト
- ☰ボタンでパネルの表示切替
お気に入り時間枠
- コンマ区切り入力による設定可能なクイックアクセス行(例:m1, h1, D1)
- レンジやティックを含むすべての時間枠タイプをサポート
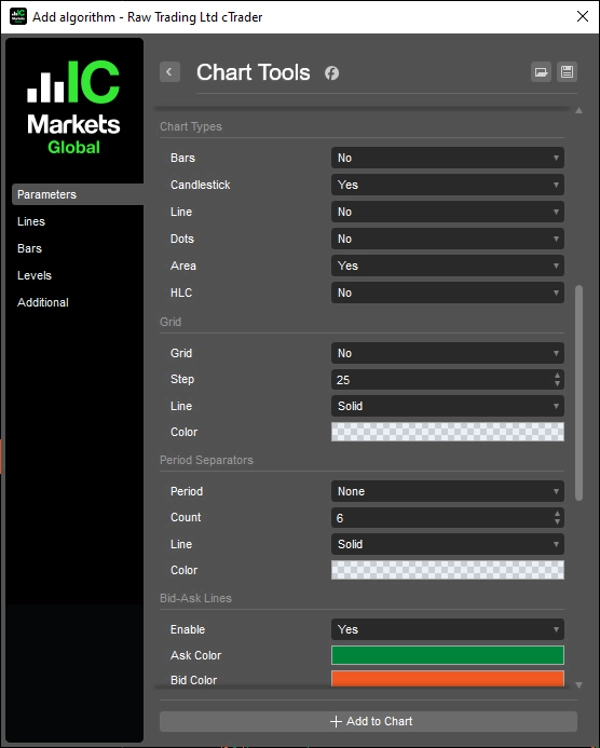
チャートタイプ
- バー、ローソク足、ライン、ドット、エリア、HLCのクイックスイッチボタン
- アクティブなチャートタイプは自動的にハイライト
- 各ボタンはパラメーターで個別に設定可能
グリッド
- 設定可能なピップ間隔(乗数)による丸数字ベースのグリッド
- スマートな小数点フォーマットの価格ラベル
- ラインは最後のバーから10バー先まで延長
- 有効/無効の切り替え
期間区切り
- 日次、週次、月次、年次の区切り
- 設定可能な数、色、線のスタイル、太さ
- スクロールとズームで自動更新
買値/売値ライン
- 無限に延長されるライブの買値と売値ライン
- 買値と売値の設定可能な色
- 有効/無効の切り替え
ボタン
- 位置:右上、左上、右下、左下
- 設定可能なマージン
- アクティブ状態、ズーム適用、チャート切替ボタンを含む設定可能なボタン色とテキスト色
__________________________________________________________________________________________
その他の無料インジケーター
構造やボリュームから回帰、ボラティリティ、カスタム時間枠まで、幅広い市場分析ツールを探求してください。
ソースコードはGitHub リポジトリで利用可能です。
すべて無料で使用できますが、コーヒーサポートを送りたい場合は こちらからどうぞ。
サポート/レジスタンス
ボリューム
移動平均
- SSLチャネル
- アンカード移動平均
- 偏差スケール移動平均
- ギャンハイローアクティベーター
- 瞬時トレンドライン
- トレンドビジョン付きカウフマン適応MA
- 移動平均チャネル
- 移動平均スイート
- トレンドチャネル移動平均
ユーティリティ/カスタム
回帰ベース
ボラティリティ
オシレーター
__________________________________________________________________________________________
免責事項
取引にはリスクが伴います。このインジケーターは技術分析専用です — 常に適切なリスク管理を行い、責任を持って取引してください。
フィードバックと改善
ご提案、機能リクエスト、改善案があれば、ディスカッションタブにコメントを残してください。皆様のフィードバックがインジケーターの改善に役立ちます。
概要
Users can configure a quick-access row of favorite timeframes supporting all timeframe types. The chart type switcher offers quick buttons for Bars, Candlestick, Line, Dots, Area, and HLC charts, each with individual configuration and automatic active state highlighting.
Additional features include a round numbers-based grid with configurable pip intervals and smart decimal formatting, daily to yearly period separators with customizable appearance, and live bid/ask lines extending indefinitely with color customization and toggle options.
The control panel’s buttons can be positioned in any corner of the chart with configurable margins and colors, including active states and zoom application. This tool aims to streamline active trading sessions by reducing time spent navigating native menus, supporting efficient technical analysis on various chart types and timeframes.
カスタマーレビュー
5 | 100 % | |
4 | 0 % | |
3 | 0 % | |
2 | 0 % | |
1 | 0 % |