
説明
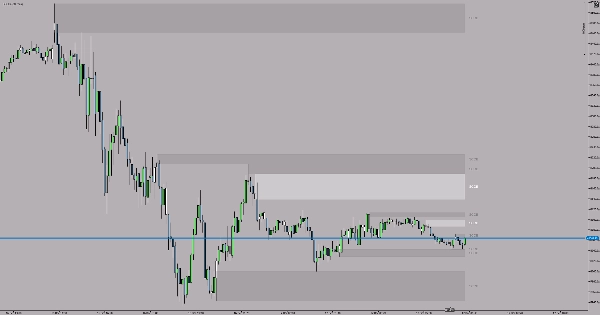
SCOB(シングルキャンドルオーダーブロック)インジケーターは、チャート上の強力なオーダーブロックパターンを自動的に識別し、ハイライトします。このシンプルで効果的なツールは、トレーダーが強い機関投資家の活動を示すことが多い重要な反転パターンを見つけるのに役立ちます。
SCOBとは何ですか?
SCOBは、潜在的な反転ゾーンを示す3本のキャンドルパターンです:
強気のSCOB:
- 2番目のキャンドルが3番目のキャンドルよりも安値を更新する
- 1番目のキャンドルの安値が2番目のキャンドルの安値を下回らない
- 1番目のキャンドルが2番目のキャンドルの高値を上回って終わる
- 2番目のキャンドルがハイライトされ、潜在的なサポートゾーンとして示されます
弱気のSCOB:
- 2番目のキャンドルが3番目のキャンドルよりも高値を更新する
- 1番目のキャンドルの高値が2番目のキャンドルの高値を上回らない
- 1番目のキャンドルが2番目のキャンドルの安値を下回って終わる
- 2番目のキャンドルがハイライトされ、潜在的なレジスタンスゾーンとして示されます
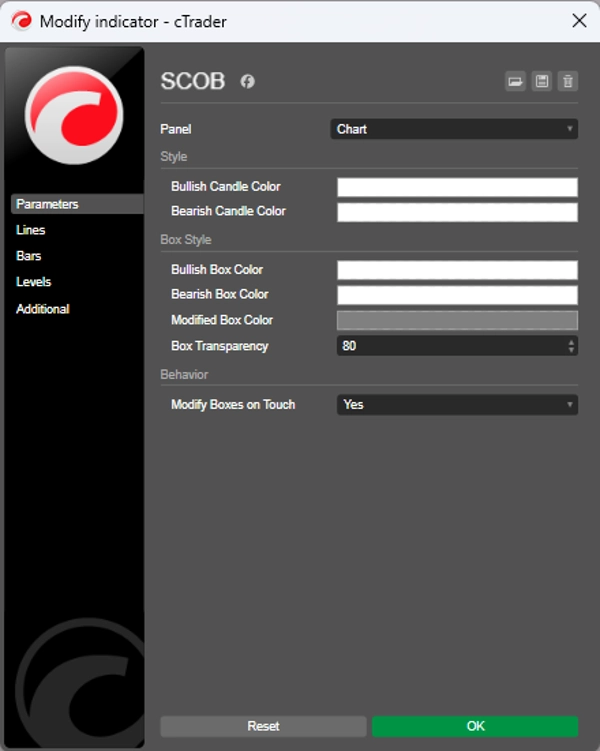
設定
強気キャンドルの色 - 強気のSCOBパターンのハイライト色を選択します(デフォルト:白)
弱気キャンドルの色 - 弱気のSCOBパターンのハイライト色を選択します(デフォルト:黄色)
使用のヒント
- SCOBパターンを使って潜在的なエントリーゾーンを特定する
- 他のテクニカル分析ツールと組み合わせて確認する
- ハイライトされたキャンドルは重要な機関レベルを表す
- より高い確率のセットアップのために常にトレンドに沿って取引する
- 取引戦略に基づいて任意の時間枠で使用可能
- ベストプラクティス:高時間足(H1、H4、日足)でSCOBパターンをマークし、トレンド方向に取引すること。
概要
インジケーターのプロフィール
カスタマーレビュー
4.5
レビュー: 2
5 | 50 % | |
4 | 50 % | |
3 | 0 % | |
2 | 0 % | |
1 | 0 % |
カスタマーレビュー
October 3, 2025
Helps more when the trader avoids forced trades. It should not replace the chart.
ディスカッション
よくあるご質問
BTCUSD
Forex
Indices
EURUSD
Commodities
GBPUSD
Prop
Scalping
SMC
Crypto
Stocks
XAUUSD
NAS100
USDJPY
cTrader Storeで入手可能な取引ボット、インジケーター、プラグインなどの商品は、第三者の開発者が提供するものであり、情報と技術の取得のみを目的としてご利用いただけます。cTrader Storeはブローカーではなく、投資助言や個人的な推奨を行うことも、将来のパフォーマンスを保証することもありません。


![「[Stellar Strategies] Market Session Ultimate」ロゴ](https://cdn.ctrader.com/image/webp/61ffd537-0125-4246-9e72-42eca1791d64_28232)


価格
登録日 05/01/2025
14
販売