説明
主要なトップとボトムのインジケーター:包括的な概要
はじめに
急速に変化するトレーディングの世界では、適切なツールを持つことが大きな違いを生みます。主要なトップとボトムのインジケーターは、市場の重要な転換点を特定するよう設計されており、トレーダーが情報に基づいた意思決定を行うことを可能にします。この強力なツールは高度なアルゴリズムを活用して重要な高値と安値を特定し、トレーディング戦略を強化し、全体的なパフォーマンスを向上させます。45分足のタイムフレームで約60%から70%の平均精度を持つこのインジケーターは、市場の動きを活用したいトレーダーにとって信頼できる資産であり、デイトレーダーやスキャルパーの両方に理想的です。
主な特徴
1. 視覚的表現
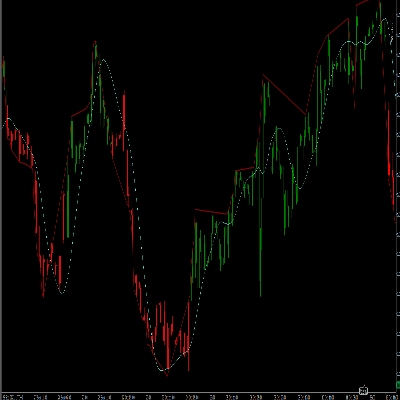
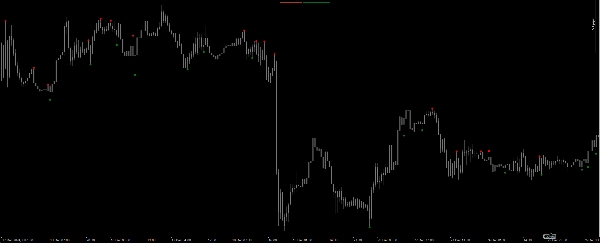
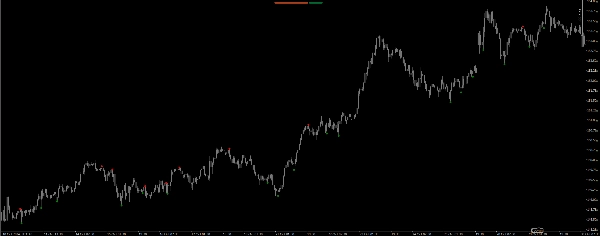
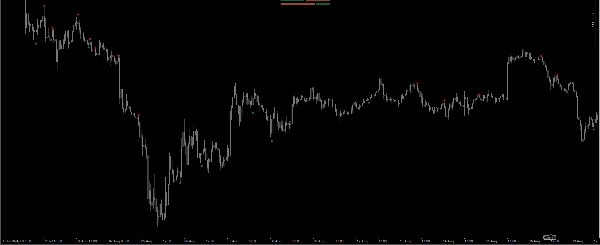
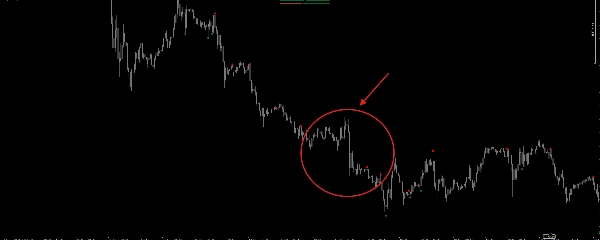
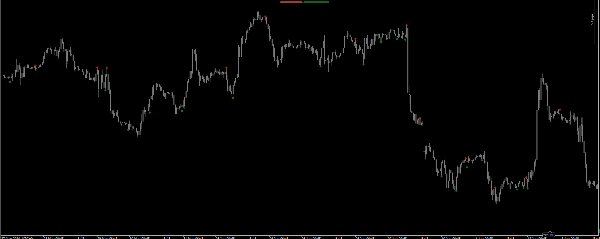
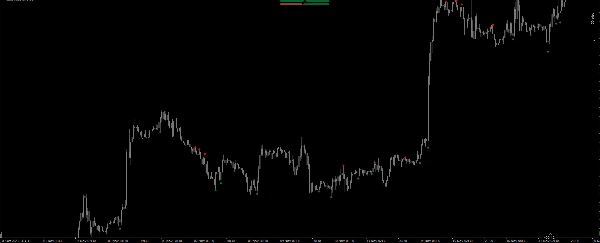
主要なトップとボトムのインジケーターは、市場の動態を明確に視覚的に表現します。主要なトップは赤で、主要なボトムは緑でマークされており、トレーダーは潜在的な反転ポイントを迅速に特定できます。ポイントの使用により、これらの重要なレベルがチャート上で際立ち、一目でトレーディングの機会を見つけやすくなっています。
2. 正確な計算
主要なトップとボトムのインジケーターの核心は、その計算方法にあります。直近の4本のバーの価格動向を分析することで、主要なトップまたはボトムが形成されたかどうかを判断します。これは高値と安値の一連の比較を通じて達成され、重要な転換点のみが特定されるようにしています。
3. 強化されたスキャルピング手法
スキャルピングを専門とするトレーダーにとって、主要なトップとボトムのインジケーターは非常に貴重な資産です。重要な転換点を特定することで、トレーダーは正確にポジションの出入りが可能になります。主要なトップとボトムを迅速に見つける能力により、タイトな利食い(TP)と損切り(SL)の設定が可能となり、リスクを最小限に抑えつつ利益の最大化が図れます。45分足のタイムフレームで約60%から70%の精度を持つため、シグナルが見逃された場合の損失を軽減するために損切りの使用を強く推奨します。
主要なトップとボトムのインジケーターを使用する利点
1. 意思決定の改善
主要なトップとボトムのインジケーターは、正確な市場分析に基づいてトレーダーが情報に基づいた意思決定を行うことを可能にします。重要な高値と安値を特定することで、トレーダーは価格の動きをよりよく予測し、それに応じて戦略を調整できます。この改善された意思決定プロセスは、全体的なトレーディングパフォーマンスを向上させます。
2. 利益の可能性の向上
重要な転換点を特定する能力により、トレーダーは市場の反転をより効果的に活用できます。主要なトップとボトムのインジケーターは、最適なタイミングでポジションを取ることを可能にし、利益の可能性を高めます。タイトなTPとSLレベルを利用することで、リスクを最小限に抑えつつ利益を最大化できます。
3. ユーザーフレンドリーなインターフェース
主要なトップとボトムのインジケーターはユーザーエクスペリエンスを考慮して設計されています。主要なトップとボトムの明確な視覚的表現により、トレーダーはインジケーターが提供するシグナルを簡単に解釈できます。このユーザーフレンドリーなインターフェースは、あらゆる経験レベルのトレーダーにとって利用しやすいものとなっています。
4. 多用途な応用
デイトレーダー、スイングトレーダー、スキャルパーのいずれであっても、主要なトップとボトムのインジケーターはさまざまなトレーディング戦略に適用できます。その多用途性により、異なる市場状況に適応するための柔軟性が高まり、あらゆるトレーダーのツールキットに価値ある追加となります。
結論
結論として、主要なトップとボトムのインジケーターは、市場の重要な転換点を特定することでトレーディング戦略を強化する強力なツールです。正確な計算、視覚的表現、cTraderプラットフォームとの互換性により、このインジケーターはトレーダーが情報に基づいた意思決定を行い、市場の動きを活用することを可能にします。約70%の精度を持つため、シグナルが見逃された場合の損失を最小限に抑えるために損切りの実装が重要です。最適な結果を得るために、このインジケーターは45分足のタイムフレームでの使用が推奨されます。経験豊富なトレーダーであれ、初心者であれ、主要なトップとボトムのインジケーターはトレーディングパフォーマンスを大幅に向上させることができます。今日、この革新的なツールを戦略に取り入れて、トレーディング体験を向上させましょう。
概要
カスタマーレビュー
5 | 50 % | |
4 | 50 % | |
3 | 0 % | |
2 | 0 % | |
1 | 0 % |