説明
PFOプライスフローオシレーターは、市場のモメンタムとボラティリティを構造的に把握するために設計されたテクニカル分析ツールです。複数の市場要因を単一の正規化されたオシレーターに統合し、異なる状況で価格の動きをより明確に解釈できるようにします。このインジケーターは無料で使用でき、外国為替、商品、指数、その他の資産に適用可能です。
仕組み
PFOオシレーターは以下に基づいて正規化された値(0~100)を計算します:
ATR(平均真の範囲):市場のボラティリティに応じて読み値をスケーリングします。
移動平均(EMA/SMA):モメンタム比較のためのトレンド基準線を提供します。
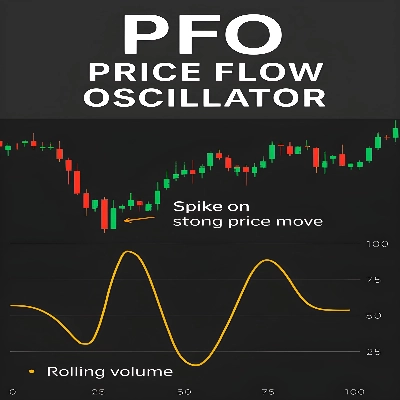
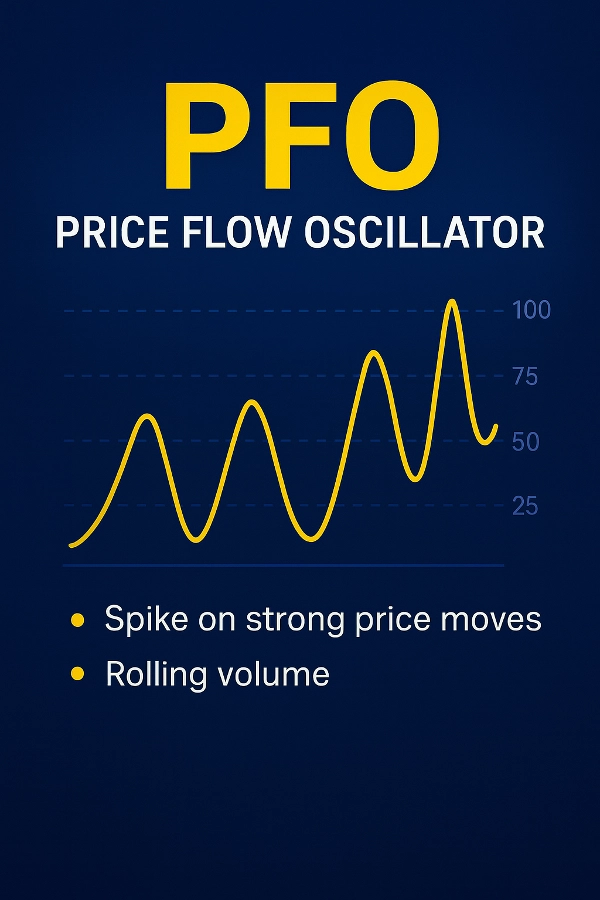
出来高分析:現在の活動をローリング平均と比較し、強い動きを強調します。
価格アクション要因:
実体の大きさとレンジの比較(ローソク足の強さ)。
ヒゲの分析(買い圧力/売り圧力)。
方向性バイアス(強気対弱気の動き)。
モメンタム対ATR:ボラティリティに対するトレンドからの偏差を測定します。
価格変動の重み付け:バー間の重要な変化を強調します。
平滑化と正規化:ノイズを除去し、0~100のスケールで結果を標準化します。
オシレーターの読み方
75以上:強い強気の状態を示します。
25以下:強い弱気の状態を示します。
50付近:中立または統合的な市場の動きを示唆します。
主な特徴
マルチファクターアプローチ:ボラティリティ、トレンド、出来高、価格アクションを統合。
明瞭さとノイズ低減のための平滑化された値。
異なる市場状況に適応するスケーリング。
複数の資産クラスと時間軸で機能。
免責事項:このインジケーターはテクニカル分析目的のみに使用されます。将来のパフォーマンスを予測したり、取引結果を保証するものではありません。ユーザーは自身の分析やリスク管理と組み合わせて使用してください。
概要
カスタマーレビュー
5 | 0 % | |
4 | 100 % | |
3 | 0 % | |
2 | 0 % | |
1 | 0 % |


