
Descrição
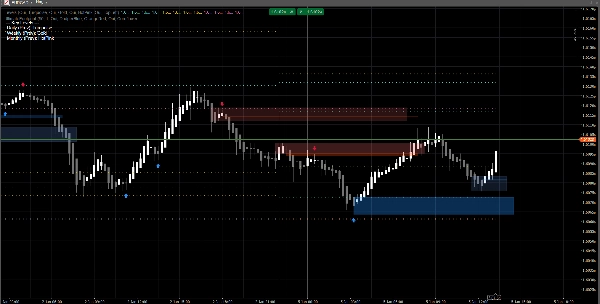
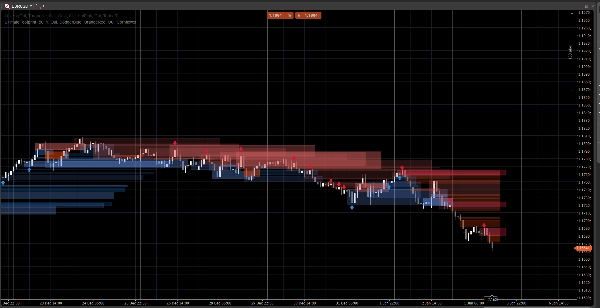
Um sistema de estrutura de mercado limpo que exibe gaps de preço, blocos de ordens e sinais baseados em rompimentos, com confirmação de volume opcional e alertas de reteste. Construído para clareza tanto em gráficos padrão quanto Renko.
Este indicador foca em legibilidade e execução, não em poluição visual. As zonas são estendidas para frente e gerenciadas automaticamente (expiração / invalidação), ajudando você a acompanhar os níveis que importam enquanto o preço se desenrola.
O que ele detecta
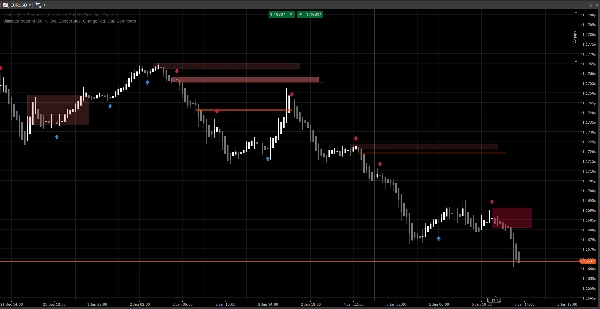
Gaps de Preço (ineficiências de 3 barras)
- Destaca gaps de alta e baixa diretamente no gráfico
- Exibição opcional (alternar ligado/desligado)
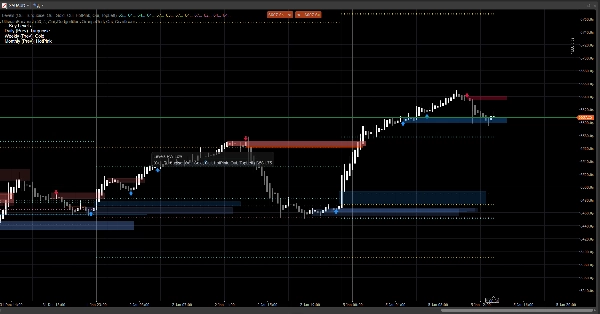
Blocos de Ordem (última vela oposta antes do deslocamento)
- Zonas OB de alta e baixa
- Estendidas automaticamente para frente até serem invalidadas / atingir extensão máxima
Sinais de Rompimento de Estrutura (lógica de rompimento de swing)
- Detecção baseada em rompimento usando máximas/mínimas de swing
- Imprime setas de sinal (para cima/para baixo) quando um novo bloco de ordem é confirmado
Atualizações em tempo real
- Projetado para atualizar suavemente em condições ao vivo
- Funciona em velas clássicas e se comporta bem em ação de preço estilo Renko
Filtragem inteligente (opcional)
Confirmação de volume
- Você pode exigir uma confirmação de Z-score de volume antes de validar um sinal de bloco de ordem
- Linha base e sensibilidade ajustáveis
Alertas (opcional)
Ative alertas para:
- Novo bloco de ordem detectado
- Reteste de bloco de ordem com direção (vela de rejeição)
Como usar (fluxo simples)
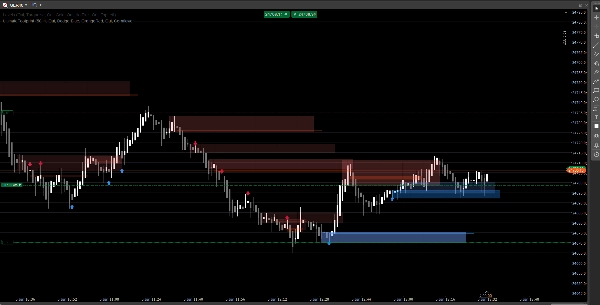
- Use Gaps de Preço e Blocos de Ordem como zonas de reação (áreas de interesse).
- Deixe os Sinais destacarem rompimentos de estrutura e a formação OB correspondente.
- Use alertas de reteste para capturar retornos à zona com comportamento de rejeição.
- Combine com suas próprias entradas/saídas (a gestão de risco continua sendo sua).
Visão geral das entradas
Lógica de Volume
- Linha Base de Volume: período de suavização usado para cálculos de Z-score
- Sensibilidade de Volume: controla o quanto o volume afeta a visibilidade da zona
Gaps de Preço
- Mostrar Gaps de Preço
- Cores de Gap de Alta / Baixa
Blocos de Ordem
- Mostrar OB
- Cores de OB de Alta / Baixa
- Extensão Máxima: até onde as zonas se estendem para frente
Sinais
- Mostrar Setas
- Retrospectiva de Swing: define a janela de detecção de swing
- Exigir Confirmação de Volume (opcional)
- Limite de Volume + Período de Volume
- Cores dos Sinais
- Transparência da Zona
- Barras de Extensão Máxima (sinais)
Alertas
- Ativar Alertas
- Alerta Novo OB
- Alerta de Reteste
FAQ
1) Ele redesenha?
Não.
O indicador não “move” sinais históricos para novos locais após o fechamento da barra.
- Zonas (retângulos de Gaps / OB) são criadas a partir de barras históricas e então estendidas para frente.
- Sinais (setas) são confirmados a partir de condições de barra fechada (rompimento de swing + seleção OB).
Uma vez que uma seta é impressa, ela não é realocada retroativamente.
Nuance importante (comportamento normal):
Enquanto a barra atual ainda está se formando, os preços (Alta/Baixa/Fechamento) ainda podem mudar. Isso pode causar:
- uma zona a atualizar sua extensão na borda direita (extensão visual),
- uma condição de reteste a ser temporariamente verdadeira e depois falsa na mesma barra em formação.
Isso não é redesenho— é atualização em tempo real em uma vela incompleta.
2) Qual a diferença entre “redraw” e “repaint” aqui?
Redraw = sim (por design).
Repaint = não.
- Redraw significa que os retângulos são redesenhados/estendidos no gráfico para que a zona continue projetando para o futuro. Isso é necessário para uma sobreposição ao vivo no estilo “pegada”.
- Repaint significaria que o indicador altera sinais confirmados passados (setas/zonas) depois do fato. Isso não acontece.
3) Por que as zonas às vezes mudam de forma ou opacidade?
Porque as zonas são ponderadas por volume usando um modelo de Z-score:
SMA(volume)+StdDev(volume)sobre seu período base- opacidade/alpha escala com a variação do volume
Então, se você alterar:
- Linha Base de Volume
- Sensibilidade de Volume
- ou o feed do símbolo for diferente
A intensidade visual pode variar. A localização da zona permanece baseada no preço; a visibilidade pode refletir o contexto do volume.
4) Por que alguns alertas às vezes “faltam” ou estão “desligados”?
Existem 3 razões técnicas, e todas são intencionais:
A) Alertas exigem uma condição estrita de confluência
Para um alerta de reteste, o indicador exige:
- o preço sobrepõe a zona OB, E
- uma condição de vela de rejeição é atendida (exemplo: rejeição de alta requer
Fechamento > Abertura)
Se o preço tocar a zona mas fechar neutro / oposto, nenhum alerta de reteste é disparado.
B) Lógica de alerta única (anti-spam)
Cada OB tem uma flag interna (ex: Alertado) para que você não receba alertas repetidos a cada tick.
Então, se o primeiro toque não atendeu à regra de rejeição, e depois atende mas a flag já foi definida (dependendo da sua versão), pode parecer “desligado”.
C) Comportamento do tipo de gráfico (Renko / agregação de ticks)
No Renko, o “tijolo atual” não é uma vela clássica. Durante a formação:
- Abertura/Fechamento podem ser instáveis ou iguais
- a lógica de reteste pode ocorrer intrabar mas não confirmar no fechamento
No trading ao vivo, para máxima confiabilidade:
- Alertas de novo OB geralmente são limpos
- Alertas de reteste são melhores tratados como alertas de “rejeição confirmada” (não apenas toque de pavio)
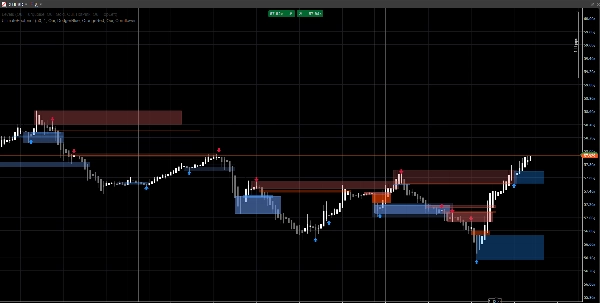
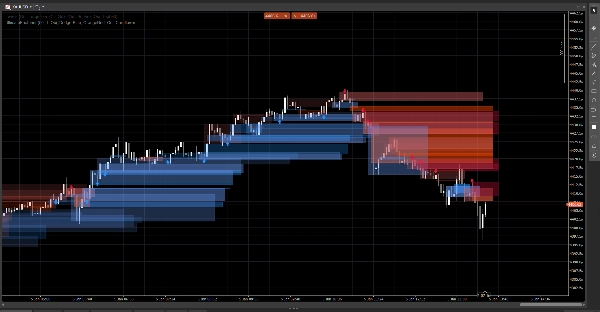
5) Na captura de tela: por que alguns OBs não mostram uma seta (ou por que a seta não corresponde a todos os OBs)?
Porque zonas e setas não são o mesmo motor:
- Zonas (retângulos OB) podem ser exibidas a partir da lógica de detecção de zona (OB derivado de gap / zonas de ação de preço).
- Setas são impressas apenas quando um evento de estrutura é detectado:
-
- uma máxima/mínima de swing é rompida (Rompimento de Estrutura),
- então o algoritmo busca para trás para encontrar a última vela oposta = o OB válido.
Então você pode ver uma zona OB sem uma seta se:
- não houve rompimento de swing validado,
- o candidato OB não atendeu ao filtro de volume (se ativado),
- ou é uma zona criada pelo motor de gap mas não confirmada pelo motor de estrutura.
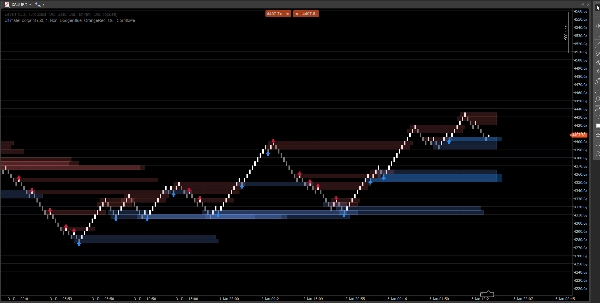
É exatamente por isso que a ferramenta é útil:
Zonas dão o mapa. Setas destacam os momentos de maior confluência.
6) Posso forçar os OBs a sempre corresponderem às setas?
Sim, tecnicamente você pode rodar no modo “apenas sinais” desativando a camada de zona que não deseja:
- Desligue Gaps de Preço se quiser apenas zonas guiadas pela estrutura
- Desligue Mostrar OB (zonas) se quiser apenas OBs confirmados por setas
7) Funciona em todos os timeframes e símbolos?
Sim, mas os resultados dependem de:
- volatilidade,
- liquidez,
- qualidade do volume de ticks,
- e a sessão de mercado.
Cripto e índices se comportam de forma diferente do FX.
Notas & Aviso Legal
Este indicador é uma ferramenta visual de suporte à decisão, não um serviço de sinais e não constitui aconselhamento financeiro.
Todos os mercados e timeframes se comportam de forma diferente — sempre valide com seus dados e gerencie o risco adequadamente. Comportamento passado não garante resultados futuros.
Resumo
Avaliações de clientes
5 | 100 % | |
4 | 0 % | |
3 | 0 % | |
2 | 0 % | |
1 | 0 % |