
Descrição
Indicadores da loja Pinescriptlabs: cBots da loja Pinescriptlabs : (cBot) Gold & BTC BreakoutSession Pivots(novo)
PRICE ACTION (Novo)
Trailing Smart Algorithm (novo)
Prediction Based on Linreg & ATR
SmartTrend Support &
Resistance
Lines
Dynamic
Market Structure
Analysis
of
Turning
Points
Fibonacci
Linear
Regression
Multi-timeframe
Multi-Level
Candle Bias
Tracker
Auto
Support and
Resistance
Trend
Lines
All
Support and
Resistance
Levels
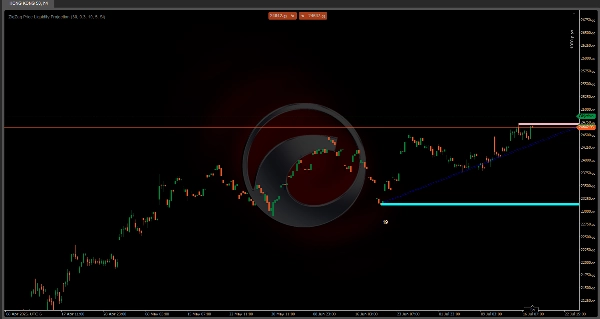
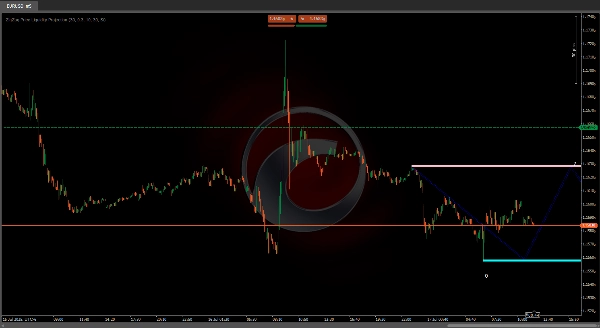
📊 Indicador de Projeção de Liquidez de Preço ZigZag
"Veja onde o mercado pode virar antes que isso aconteça!" 🔮
Este indicador identifica níveis-chave de suporte/resistência 🛑 e prevê zonas de liquidez 💧 no seu gráfico usando:
- 🔍 Pontos de Pivô: Detecta máximos e mínimos significativos
- 📈 Volatilidade ATR: Mede flutuações de preço para ajuste preciso
- 💦 Projeções de Liquidez: Antecipam áreas de alta atividade (aglomerados de compra/venda) através de padrões zigzag
🎯 Propósito: Prevê zonas de reação de preço (rebotes/rupturas/consolidações) para melhorar decisões de entrada/saída
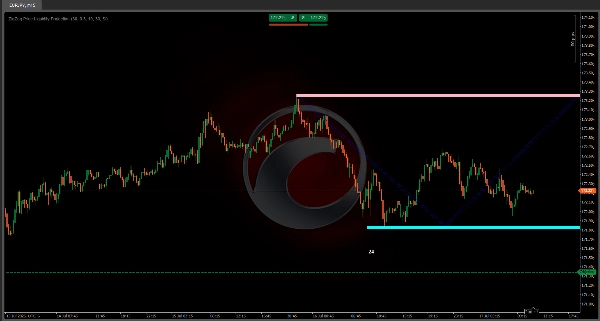
✨ A Vantagem do Zigzag
Essas linhas conectadas funcionam como um mapa do tesouro 🗺️ mostrando:
1️⃣ Caminhos futuros de preço dentro de faixas definidas
2️⃣ Zonas potenciais de reversão onde o preço pode parar ou reverter
3️⃣ Pontos de referência visuais para planejamento de trades
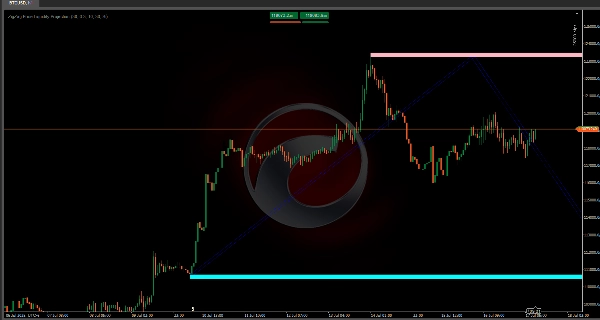
🚦 Principais Características:
- 📅 Sistema de alerta precoce para níveis importantes
- 🎯 Projeta movimentos futuros baseado em estruturas de pivô (caminhos de alta/baixa)
- 🔢 Contadores de toque (ex.: "24" = 24 testes históricos nesse nível)
⚙️ Configurações Recomendadas
ConfiguraçãoValorEfeito
Período ATR
30
🎚️ Sensibilidade à volatilidade
Período de Pivô
30
🔍 Alcance de significância do pivô
⏳ Melhores Timeframes: gráficos de 15min - 4hr ⏱️
💡 Dica Profissional:
"Combine com padrões de velas 🕯️ para confirmação! O zigzag mostra ONDE o preço pode ir, as velas mostram QUANDO isso está acontecendo."
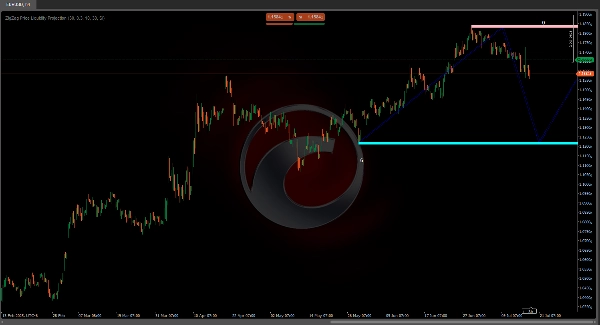
🎯 Conclusão Final:
Uma poderosa ferramenta visual tudo-em-um para identificar:
✅ Zonas de liquidez 💦
✅ Níveis críticos 🎯
✅ Caminhos futuros de preço 🚀
Perfeito para traders intradiários que querem antecipar movimentos em vez de persegui-los! 🏃💨


