
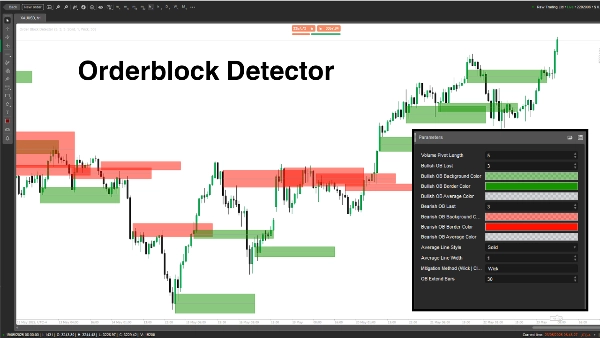
O indicador "Order Block Detector" foi criado para identificar e exibir Order Blocks (OBs) no gráfico de preços — zonas-chave onde grandes players (instituições) colocam ordens significativas de compra ou venda, frequentemente desencadeando fortes reações de preço. Ele ajuda os traders a identificar potenciais zonas de suporte/resistência para entradas de trade mais inteligentes, stop-losses ou take-profits.
Conceito
- Order Blocks: São zonas de preço onde o mercado reverte ou pausa devido ao intenso fluxo de ordens institucionais. O indicador detecta OBs analisando picos de volume pivot e o estado do mercado (altista/baixista).
- Como funciona:
-
- Determina o estado do mercado (altista/baixista) comparando máximas/mínimas com um período de retrocesso (Length).
- Identifica OBs em picos de volume ligados a níveis-chave de preço.
- Desenha retângulos e linhas médias para marcar OBs, enquanto verifica e remove OBs mitigados quando o preço rompe.
- Caso de uso: Traders podem usar OBs como zonas de alta probabilidade para configurações de trade, gerenciamento de risco ou metas de lucro.
Detalhamento dos Parâmetros
- Comprimento do Pivot de Volume (Length, Padrão: 5, Mín: 1)
-
- O que faz: Define o período de retrocesso (número de barras) para calcular máximas/mínimas e picos de volume pivot.
- Por que importa: Um comprimento maior aumenta a precisão, mas reduz a frequência de OBs; comprimento menor captura mais OBs, mas pode incluir ruído.
- Último OB Altista (BullExtLast, Padrão: 3, Mín: 1)
-
- O que faz: Limita o número de OBs altistas armazenados e monitorados.
- Por que importa: Limita o número de OBs altistas exibidos para manter o gráfico limpo e otimizar o desempenho.
- Cor de Fundo do OB Altista (BgBullCss, Padrão: #80169400)
-
- O que faz: Define a cor de fundo e transparência dos retângulos dos OBs altistas.
- Por que importa: Ajuda a distinguir visualmente os OBs altistas no gráfico.
- Cor da Borda do OB Altista (BullCss, Padrão: #169400)
-
- O que faz: Define a cor da borda dos retângulos dos OBs altistas.
- Por que importa: Melhora a visibilidade das zonas de OB altistas.
- Cor Média do OB Altista (BullAvgCss, Padrão: #609598A1)
-
- O que faz: Colore a linha média dentro dos OBs altistas.
- Por que importa: Marca o ponto médio do OB, servindo como nível de referência chave para os traders.
- Último OB Baixista (BearExtLast, Padrão: 3, Mín: 1)
-
- O que faz: Limita o número de OBs baixistas armazenados e monitorados.
- Por que importa: Assim como o BullExtLast, mantém o gráfico organizado limitando os OBs baixistas.
- Cor de Fundo do OB Baixista (BgBearCss, Padrão: #80FF1100)
-
- O que faz: Define a cor de fundo e transparência dos retângulos dos OBs baixistas.
- Por que importa: Diferencia os OBs baixistas dos altistas.
- Cor da Borda do OB Baixista (BearCss, Padrão: #FF1100)
-
- O que faz: Define a cor da borda dos retângulos dos OBs baixistas.
- Por que importa: Destaca os OBs baixistas para rápida identificação.
- Cor Média do OB Baixista (BearAvgCss, Padrão: #609598A1)
-
- O que faz: Colore a linha média dentro dos OBs baixistas.
- Por que importa: Destaca o nível central de preço dos OBs baixistas para planejamento de trades.
- Estilo da Linha Média (LineStyle, Padrão: Sólido)
-
- O que faz: Define o estilo da linha média do OB (Sólido, Tracejado, Pontilhado).
- Por que importa: Personaliza a aparência da linha média para adequar às preferências do trader.
- Largura da Linha Média (LineWidth, Padrão: 1, Mín: 1)
-
- O que faz: Ajusta a espessura da linha média do OB.
- Por que importa: Controla o quão proeminente a linha média aparece no gráfico.
- Método de Mitigação (Mitigation, Padrão: "Wick")
-
- O que faz: Define como os OBs são invalidados:
-
- Wick: Usa o preço mais baixo (OB altista) ou mais alto (OB baixista) para verificar a mitigação.
- Close: Usa o preço de fechamento para verificar a mitigação.
- Por que importa: Afeta a sensibilidade do indicador à quebra das zonas de OB, impactando quando os OBs são removidos.
O Order Block Detector é uma ferramenta poderosa para identificar zonas de ordens institucionais baseadas em picos de volume e ação de preço. Ele desenha retângulos claros de OB com linhas médias e remove dinamicamente os invalidados. Traders podem ajustar os parâmetros para aprimorar a detecção, exibição e gerenciamento dos OBs conforme seu estilo de negociação.
5 | 100 % | |
4 | 0 % | |
3 | 0 % | |
2 | 0 % | |
1 | 0 % |


![Logótipo de "[CB] Pivot Points Pro"](https://cdn.ctrader.com/image/webp/43463c82-67b0-4f10-a4ba-901bba091d81_32594)


