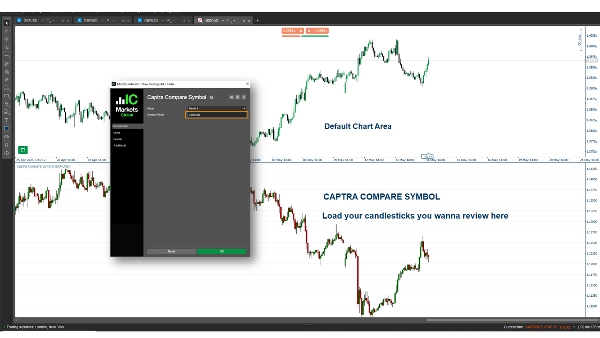
Indikator
eurusd
Logo "Compare Symbol"
Compare Symbol
0.0
03/09/2025
52
Desktop

Captra Compare Symbol is a cTrader indicator that displays the close price and draws candlesticks (wick, body) for a selected symbol, like EURUSD, on the chart. It supports various timeframes (e.g., 5M, 15M, 1H, Daily) with customizable visuals, using open/close/high/low prices for accurate representation.

More from this author
Order Block Finder
Order Block Detector is built to spot and display Order Blocks on chart, often triggering strong price reactions.
High TF Plotter
Captra High TF Plotter visualizes high timeframe Bar on lower timeframe charts, highlighting with bull/bear colors.
Head Shoulders Finder
Detects Head & Shoulders patterns, plots signals, and alerts for trading opportunities.
Time Marker
CaptraTimeMarker: Marks key trading hours with lines & labels, plus daily separators for cTrader. Customizable & precise
Bar Explosion
cTrader indicator with mini-timeframe candlesticks. Customize timeframe, colors, margins. Perfect for traders.
Anda mungkin juga suka
Indikator
forex
commodities
crypto
+1
Trend Lines Auto - FXMaster
Auto Trend Line Indicator for cTrader
Indikator
forex
indices
vwap
+14
Volume Profile Pivot Anchored
Anchor volume profiles to pivots with POC, VAH, VAL and real-time insights for clearer trade decisions.
Vice TrendTrading
Unlike most indicators that show signals blindly, this show valid entries inside TREND ZONES and visual trend BACKTESTS.
Indikator
breakout
btcusd
supertrend
+6
Fair Value Gap Sessions
identify and highlight temporary market inefficiencies known as "fair value gaps" 🚨 within specific trading Sessions.
Indikator
forex
prop
indices
+4
New Way Sar - Free
The Parabolic SAR, or "Stop and Reverse," is a dynamic technical analysis tool
RT Moving Average PRO v1.1
Customize your Moving Average! Choose any timeframe and price source for precision and flexibility in your analysis.
TS_Pivot
Those who are involved in trading know how important it is to take into account the previous session. With Order Block
Fibonacci Prediction Channel
Designed to plot a future prediction channel based on Fibonacci retracement levels 📊
Indikator
forex
prop
commodities
+2
Light-Version BrickAlgo TrendPulse
🚀 Simplify Your Trading Decisions With Powerful Technical Analysis.
VegaXLR - Auto Support and Resistance
cTrader Auto Support & Resistance detects key levels with Fibonacci analysis and sends real-time trading alerts.
Indikator
breakout
rsi
macd
ZigZagColor
The ZigZag indicator is a technical analysis tool primarily used to identify key price reversal points.
Indikator
breakout
ORB v1
Opening Range Breakout (ORB) - Visual Edition
MTF Candles
Multi Timeframe Candle drawing. Draw Any candles from any timeframe on your chart :-)
High TF Plotter
Captra High TF Plotter visualizes high timeframe Bar on lower timeframe charts, highlighting with bull/bear colors.
DailyPivotPoints
Daily Pivot Points plots key support and resistance levels to guide precise trading decisions.
DMI MONDAY ZONES v2.1
Marks Monday's OPEN,HIGH & LOW. These are areas of support and resistance for the week.
Indikator
breakout
rsi
Lozano Price Action
LPA simplifies trading by coloring candles with volume data and RSI levels for trend and reversal insights.
Indikator
breakout
forex
btcusd
+9
Square Matrix Trading System
Square Matrix Trading System by LudwigICT – Institutional-Grade Trading Clarity in cTrader