
Market Polarity Zones
指标
217 下载
版本 1.0, Jul 2025
Windows 版、Mac 版
说明
🚀 超过10,000名交易者已经在使用我们的顶级指标 🏆 …社区还在不断壮大!
发现专业人士为何选择我们 – cTrader最强大的工具 (指标 + 算法 + cBots) 正在等待您。
👉 在这里获取我们所有的顶级系统:
Pinescriptlabs 商店指标: Pinescriptlabs 商店 cBots : (cBot) 黄金 & BTC 突破交易时段枢轴(新)
高级市场结构:Bos, Choch, SwinLevels, 订单区块, 市场结构与流动性探测器 (新)
智能追踪算法 (新)
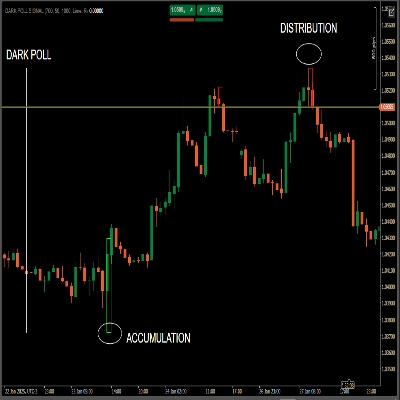
市场极性区 📊
这个算法的作用是什么?
市场极性区 是一种高级指标,通过自动识别牛市 🚀 或熊市 🐻 阶段,简化市场分析,并标记趋势反转可能发生的关键水平。
适合以下人群:
- 价格行为交易者
- 波段交易者
- 剥头皮交易者,...需要快速识别 市场方向 和 精准的进出场点。
逻辑是如何运作的?
该算法使用 两个不同周期的Hull移动平均线(HMA)来检测动量变化,并按以下方式设置动态水平:
- 检测HMA交叉以识别趋势变化。
- 设置自动水平:
-
- 看涨交叉 →标记低点为 支撑位
- 看跌交叉 →标记高点为 阻力位
- 保持当前活跃水平直到出现新的交叉。
您将在图表上看到:
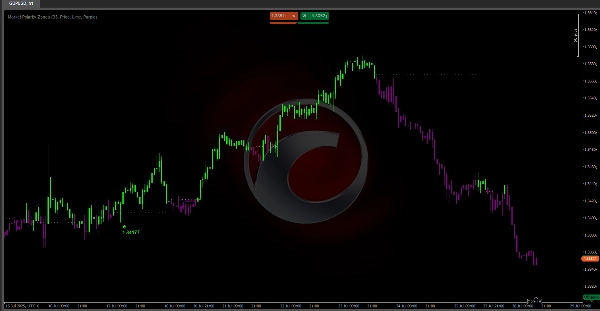
🎨 直观的颜色系统:
- 绿色蜡烛 🟢:价格高于水平(看涨区 – 寻找买入)
- 紫色蜡烛 🟣:价格低于水平(看跌区 – 寻找卖出)
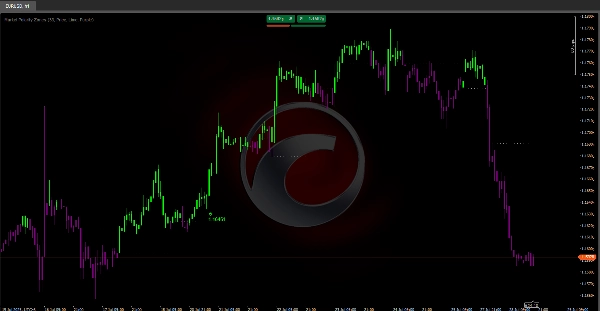
📉 动态水平线:
- 虚线水平线标记当前极性水平
- 自动延伸只要该水平有效
- 仅在水平稳定时显示
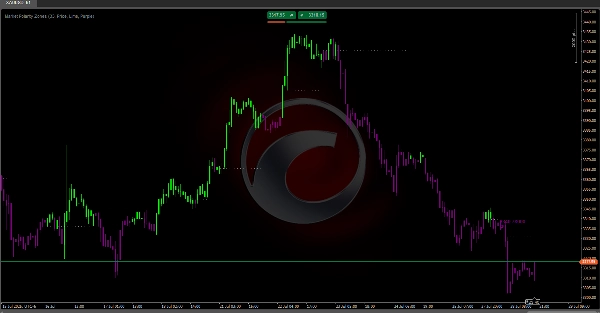
⚠️ 反转提醒:
当特定形态形成时,箭头标签会出现:
- 🔻 看跌反转(紫色标签):
-
- 形态:价格上涨 → 失败 → 跌破水平
- 含义:看涨压力减弱,可能转向 看跌区
- 🔺 看涨反转(绿色标签):
-
- 形态:价格下跌 → 反弹 → 突破水平
- 含义:买方守住该水平,可能转向 看涨区
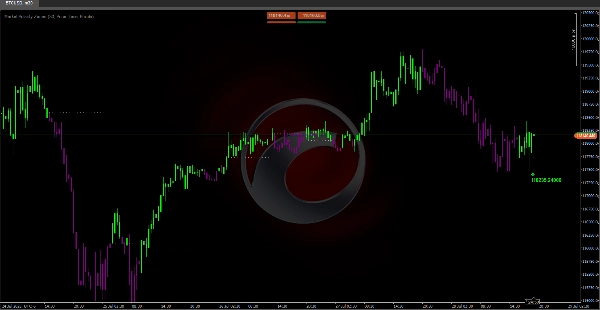
ℹ️ 标签信息:
- “价格”:显示精确的突破失败点– 用于设置精准止损或识别关键阻力/支撑。
- “成交量”:最近3根K线的成交量总和 – 确认反转是否有真实的市场参与。
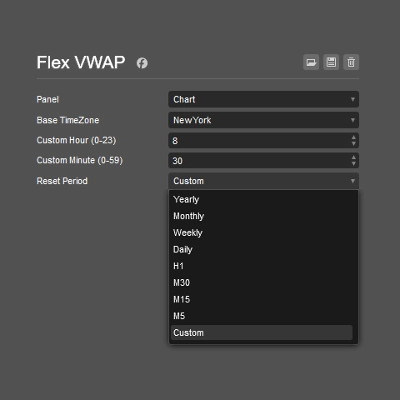
推荐设置:
- 长度:33(默认)– 适用于大多数市场
- 标签数据:“价格”用于水平精度,“成交量”用于确认
- 颜色:保持青柠绿/紫色以获得最佳视觉对比 🎨
摘要
指标配置
客户评价
0.0
评价:0
客户评价
该产品尚无评价。已经试过了?抢先告诉其他人!
讨论
常见问答
cTrader Store 提供的所有产品,包括交易机器人、指标和插件,均由第三方开发者提供,仅供信息参考和技术访问之用。cTrader Store 并非经纪商,不提供投资建议、个人推荐或任何未来业绩保证。


猜您喜欢


价格
注册日期 03/10/2024
163
销售
37.71K
免费安装