
说明
该指标基于分析 价格行为 📈 来识别市场结构的变化和关键关注区域。以下是其工作原理的详细总结:
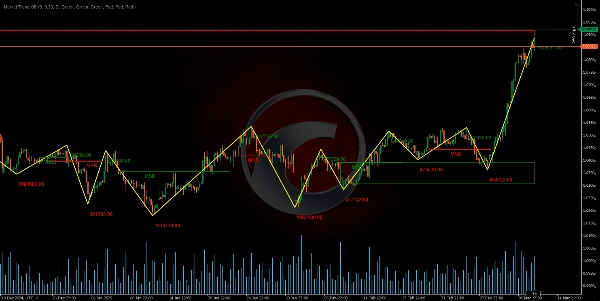
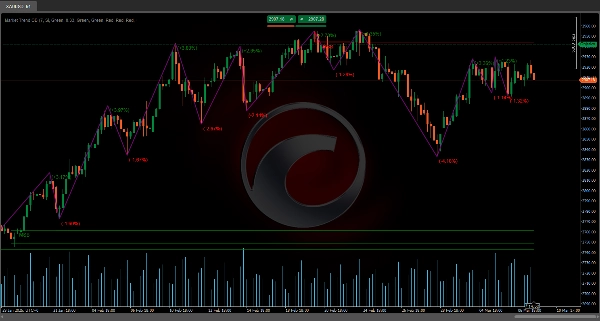
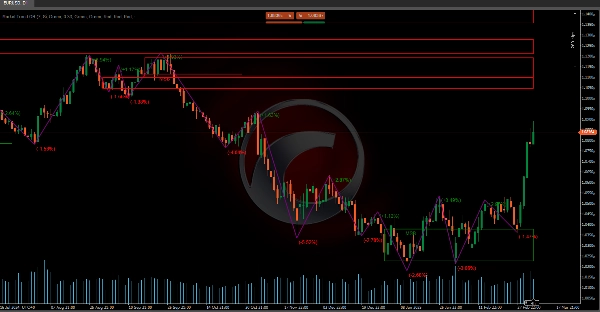
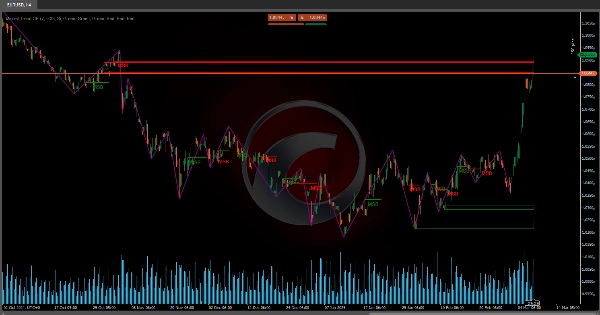
枢轴点的检测及之字形图的形成 🔄
分析特定周期(由长度参数定义)以识别相对高点和低点。通过比较该区间内的价格, 枢轴点 (拐点)被检测出来,进而形成 之字形图案 ⚡。该图案有助于区分何时发生了 价格反转。
成交量累积与偏差计算 📊
在枢轴点检测过程中, 成交量 在评估区段内被累积。此外,计算枢轴价格之间的百分比差异,以确定该变动是否足够显著。该偏差与定义的阈值进行比较,有助于确认结构变化是 真实的 ✅。
市场结构突破(MSB)的定义 🚨
指标评估最近的两个枢轴点(无论是高点还是低点),并通过应用 回撤因子 (灵感来自斐波那契水平),判断是否发生了 结构突破。
- 如果在突破旧高点后,价格开始产生 更低的低点,则识别为向 看跌结构 转变 🐻。
- 同样地,如果在突破旧低点后,价格产生 更高的高点,则假定为向 看涨结构 转变 🐂。
这种变化被解释为 市场结构突破(MSB)。
订单区块和突破箱的识别 📦
一旦检测到MSB,基于之前的价格行为定义关键区域:
- 订单区块(OB) 🧱:这些被识别为突破前最后一次重要动作发生的区域。在看跌结构中,使用突破新高前的最后一根 看涨蜡烛;在看涨结构中,使用突破新低前的最后一根 看跌蜡烛。
- 突破箱(BB) 📈:这些类似确定,但考虑了额外范围以确认价格突破了之前的水平。
这些区域有助于定义未来可能作为 支撑或阻力 的活动集中区。
相关之字形数据的可视化 📊
除了绘制枢轴点序列外,指标还包含额外数据:
- 反转价格 💹:记录检测到趋势变化的确切数值。
- 反转百分比变化 🔄:计算新枢轴价格与前一个枢轴价格之间的百分比变化,显示变化的幅度。
- 累积成交量 📉:显示导致枢轴形成区段内的成交量总和。
这些数据允许评估 运动的强度和相关性,无需依赖假设,因为它基于具体计算。
总之,该工具分析价格行为以检测市场何时改变趋势(MSB),并定义可能对 交易决策 关键的区域(订单区块和突破箱)💼。结合之字形图案与 成交量分析 及 百分比偏差,提供了市场结构的全面视角,精确展示了 反转点 及 运动的强度 💪。
Ctrader 商店指标:
Dynamic Market Structure
Analysis of Turning Points
Fibonacci Linear
Regression Multi-timeframe
Multi-Level Candle Bias
Tracker
Auto Support and
Resistance Trend Lines
摘要
It defines Market Structure Breaks (MSB) by evaluating recent pivots with a retracement factor inspired by Fibonacci levels. A break in structure is signaled when price action shifts from higher highs to lower lows (bearish) or from lower lows to higher highs (bullish).
Upon detecting an MSB, the indicator identifies critical zones: Order Blocks (OB), representing the last significant candle before a breakout, and Breakout Boxes (BB), which confirm price level breaches with an additional range. These zones serve as potential future support or resistance areas.
The tool visualizes relevant zigzag data, including reversal prices, percentage changes, and accumulated volume, enabling assessment of movement strength and relevance based on concrete calculations. This comprehensive approach integrates zigzag patterns, volume analysis, and deviation metrics to provide precise information on reversal points and market movement strength, supporting informed trading decisions.
客户评价
5 | 100 % | |
4 | 0 % | |
3 | 0 % | |
2 | 0 % | |
1 | 0 % |


