
Market Entropy
Indicador
107 transferências
Versão 1.0, Aug 2025
Windows, Mac
Desde 26/05/2025
388.58M
Volume negociado
60.75K
Pips ganhos
15
Vendas
1.41K
Instalações gratuitas
Descrição
Entropia de Mercado é um indicador duplo (oscilador + sobreposição opcional de preço) que quantifica a organização do mercado e sinaliza mudanças de regime ao longo de Ordem → Transição → Caos. Ele adiciona uma segunda linha, Trendness (DC), para separar tendência verdadeira de compressão de volatilidade.
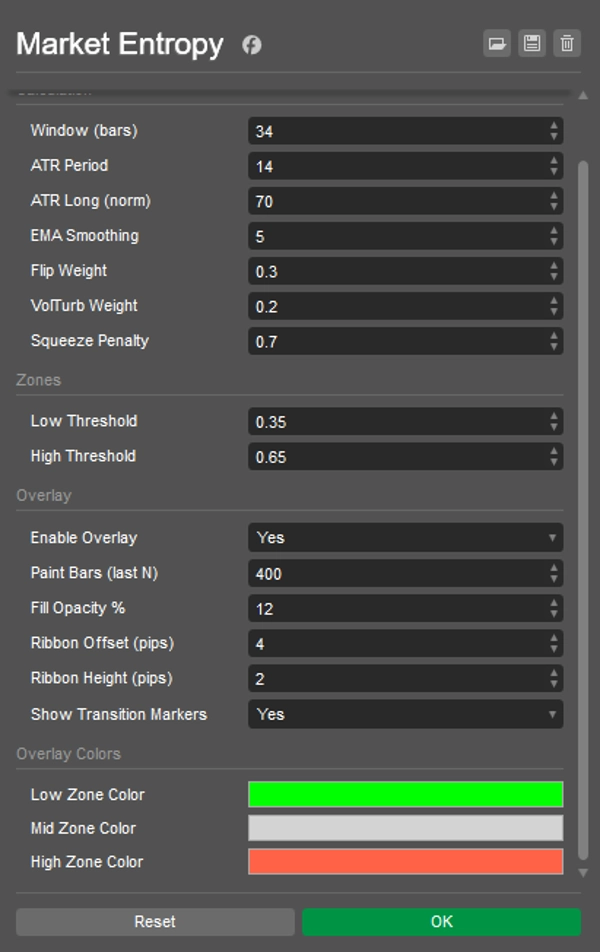
Como funciona:
- Usa apenas componentes OHLCV: DC (consistência direcional), FlipRate (inversões de sinal), Volatility_n (ATR/ATRlong), VolumeTurb (desvio padrão de ΔVolume).
- Entropia bruta:
E0 = 0.5*(1-DC) + 0.3*(FlipRate*VolN) + 0.2*VolumeTurb). - Termo anti-compressão reduz E durante compressões ATR → entropia final ∈ [0..1] com suavização EMA.
- Marcadores:
-
- CRYSTAL — cruzamento abaixo do LowThr (ordem emerge: tendência ou compressão pré-rompimento).
- DISSOLVE — cruzamento acima do HighThr (ordem quebra: decadência do caos/tendência).
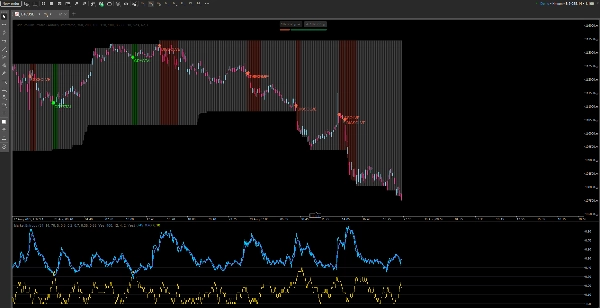
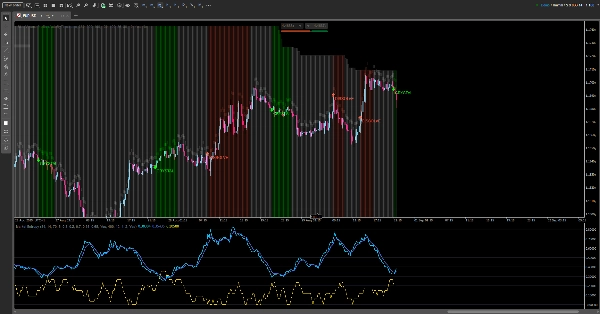
O que você vê:
- No painel: Entropia, Entropia(EMA), Trendness (DC), limites baixos/altos, fundo da zona.
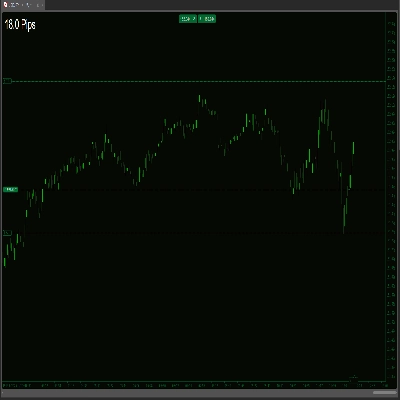
- No gráfico (ativável): barras coloridas pelo estado, uma fita fina acima das máximas, e marcadores CRYSTAL/DISSOLVE.
Guia de leitura:
- E < LowThr → Ordem:
-
- com alto DC → tendência organizada;
- com baixo ATR → compressão (espere rompimento).
- LowThr…HighThr → Transição: estrutura se formando; aguarde resolução.
- E > HighThr → Caos: incerteza / desgaste da tendência; evite entradas de continuação ingênuas.
Playbooks:
- Compressão → CRYSTAL → Rompimento/Reteste — negocie o rompimento.
- Tendência → DISSOLVE — realize lucros parciais ou ajuste o risco.
Resumo
Perfil do indicador
Avaliações de clientes
0.0
Avaliações: 0
Avaliações de clientes
Ainda não há avaliações para este produto. Já o experimentou? Seja o primeiro a contar a outras pessoas!
Conversa
Perguntas frequentes
Os produtos disponíveis através da cTrader Store, incluindo bots de negociação, indicadores e plugins, são fornecidos por programadores terceiros e são disponibilizados apenas para fins informativos e de acesso técnico. A cTrader Store não é um corretor e não fornece aconselhamento em matéria de investimento, recomendações pessoais ou qualquer garantia de desempenho no futuro.


Preço
Desde 26/05/2025
388.58M
Volume negociado
60.75K
Pips ganhos
15
Vendas
1.41K
Instalações gratuitas