
TrendStrengthSignals
Indicador
Versão 1.0, Aug 2025
Windows, Mac
5.0
Avaliações: 1
Desde 26/05/2025
385.09M
Volume negociado
60.66K
Pips ganhos
14
Vendas
1.4K
Instalações gratuitas
Descrição
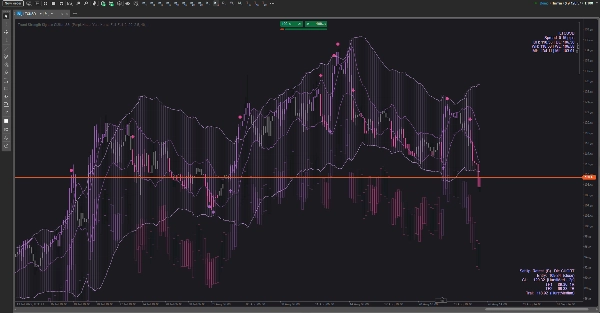
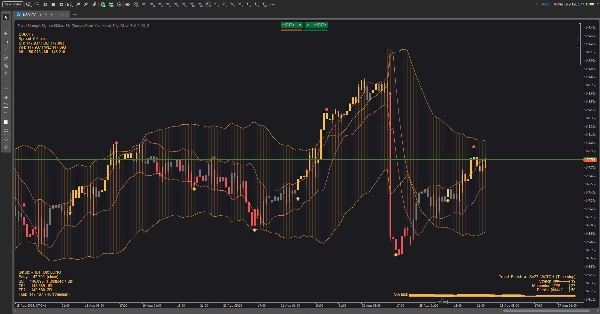
Um kit visual para negociação de tendências que combina um envelope de volatilidade com um canal cíclico para mostrar regime, timing e risco de relance. Foi projetado para ser legível em qualquer fundo (claro/escuro) e para manter a tela limpa enquanto ainda oferece dicas do “o que fazer a seguir”.
O que você vê no gráfico
- Nuvens (alternáveis):
-
- Uma nuvem de volatilidade que se expande/contrai com a atividade do mercado.
- Uma nuvem cíclica que acompanha o ritmo contínuo do preço.
- Você pode mostrar uma, ambas ou nenhuma.
- Sinais: setas discretas para cima/baixo indicando possíveis mudanças de tendência; pequenos pontos para sugestões de realização de lucro.
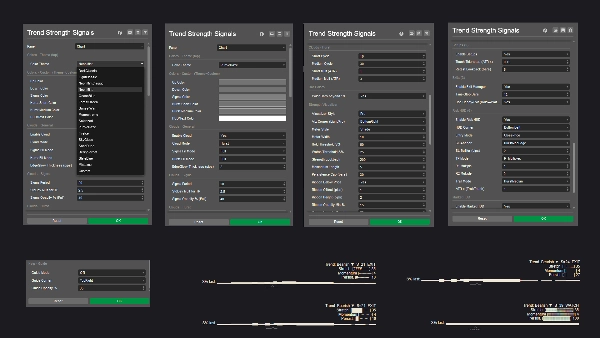
- HUD de Força da Tendência (três estilos):
-
- Leve — uma etiqueta de status compacta.
- Pro — um pequeno painel com três medidores (alongamento, momentum, persistência) mais um mini gráfico histórico.
- Fita — uma barra suave próxima ao preço cuja intensidade acompanha a força da tendência.
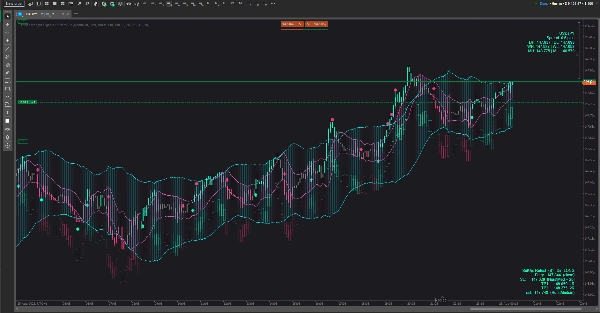
- HUD de Risco: propõe uma direção, uma área de stop protetora, dois alvos de lucro em camadas e uma ideia opcional de trailing. Pode ser posicionada em qualquer canto que você escolher e atualiza conforme a barra evolui.
- HUD de Mercado: símbolo e spread, além de referências de máxima-mínima do dia/semana/mês, para que você sempre saiba onde está dentro do mapa maior.
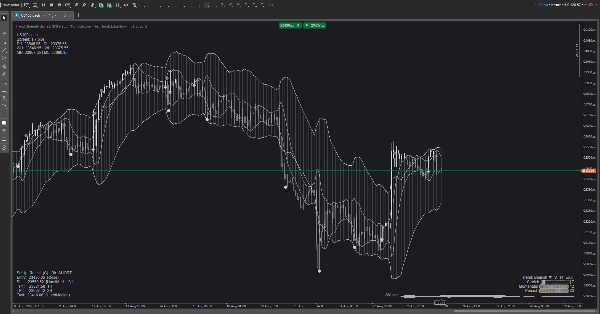
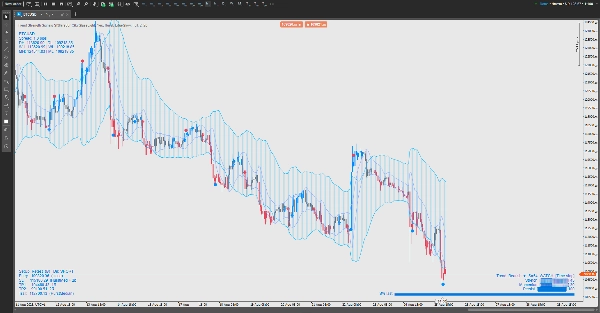
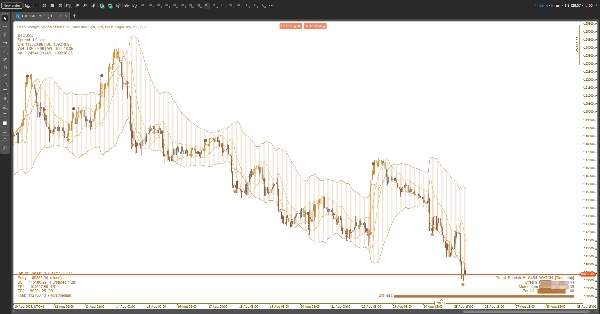
- Temas: conjuntos de cores selecionados para gráficos claros e escuros (e um modo Personalizado). Todos os elementos gráficos — incluindo HUDs e sinais — seguem o tema ativo.
Como usar (prático, não técnico)
- Escolha sua visualização de nuvem:
-
- Use a nuvem de volatilidade para ver compressões e expansões.
- Use a nuvem cíclica para julgar rotações “borda” vs “meio”.
- Use ambas se quiser contexto + timing.
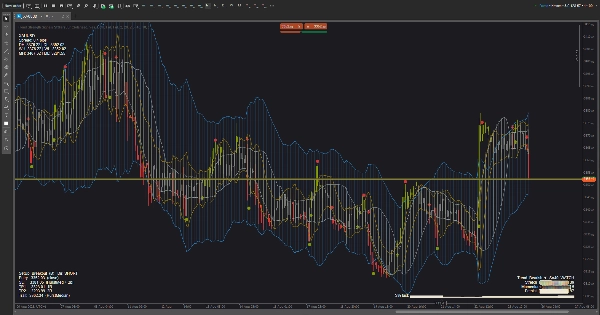
- Leia a Força da Tendência:
-
- Quando o status sobe para MANTER, favoreça negociações na direção atual; quando cai para OBSERVAR, reduza a agressividade; se mostrar SAIR, evite novas negociações ou aperte o risco.
- No modo Pro, medidores subindo + sparkline subindo = qualidade melhorando; medidores caindo = gerencie o risco para baixo.
- Cronometre entradas com preço vs nuvem:
-
- Rompimentos após compressão, reentradas após um recuo educado para a nuvem, ou repiques na borda externa são os padrões principais.
- Se uma seta precoce aparecer no meio da barra e depois desaparecer, espere a confirmação do fechamento da barra se preferir menos falsos sinais.
- Gerencie a negociação com o HUD de Risco:
-
- Coloque o stop protetor aproximadamente além do limite estrutural mais próximo que o HUD destaca.
- Realize parcial em TP1, deixe o restante mirar TP2 ou siga a linha de trailing sugerida.
- Se a Força da Tendência decair de forte para fraca, considere sair mais cedo.
- Filtros situacionais:
-
- Evite entradas quando as nuvens estiverem finas e irregulares, ou quando o status de força estiver em SAIR.
- Prefira negociações quando a força estiver aumentando, a nuvem inclinada e o preço interagindo limpo com as bordas.
Personalização
- Altere os cantos do HUD, estilo de visualização e tema de cor para combinar com seu espaço de trabalho.
- Temas amigáveis para luz mantêm o texto visível em fundos brancos; paletas oceano/floresta/por do sol adicionam contraste sutil sem ofuscamento.
O que não é não
Isto não é um autotrader de caixa-preta. É uma ajuda à decisão: enquadra a qualidade da tendência, propõe locais sensatos de risco e destaca momentos de alta probabilidade — mas você permanece no controle.
Resumo
Perfil do indicador
Avaliações de clientes
5.0
Avaliações: 1
5 | 100 % | |
4 | 0 % | |
3 | 0 % | |
2 | 0 % | |
1 | 0 % |
Avaliações de clientes
September 2, 2025
The reason it feels usable is direction is easier to respect, and a 1R exit plan makes review easier.
Conversa
Perguntas frequentes
Os produtos disponíveis através da cTrader Store, incluindo bots de negociação, indicadores e plugins, são fornecidos por programadores terceiros e são disponibilizados apenas para fins informativos e de acesso técnico. A cTrader Store não é um corretor e não fornece aconselhamento em matéria de investimento, recomendações pessoais ou qualquer garantia de desempenho no futuro.


Preço
Desde 26/05/2025
385.09M
Volume negociado
60.66K
Pips ganhos
14
Vendas
1.4K
Instalações gratuitas