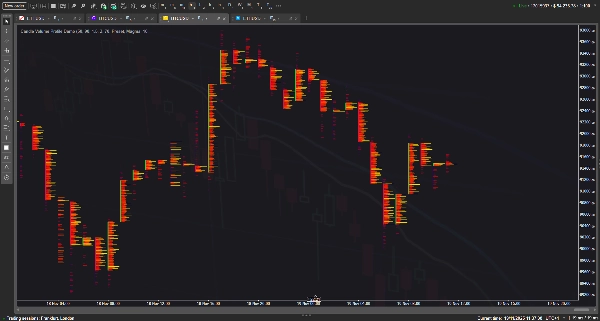
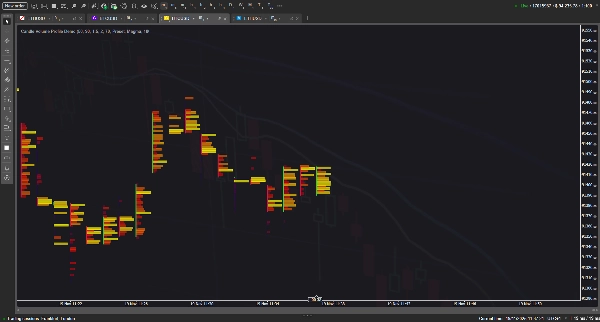
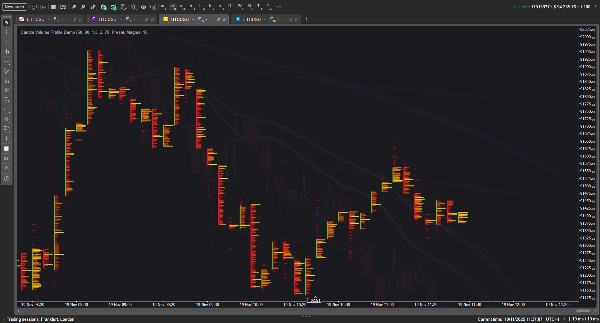
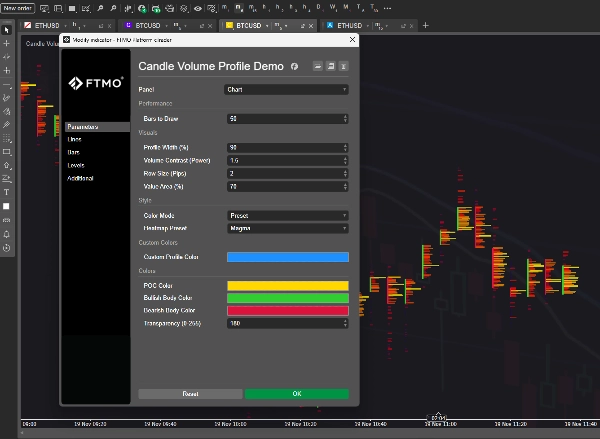
Corretores e props
Para empresas
00
Days
:
00
Hours
:
00
Minutes
:
00
Seconds
Indicador
VWAP
ZigZag
FVG
ATR
Signal
Crypto
BTCUSD
Candle Volume Profile Demo
4.0
19/11/2025
130
Desktop
Desde 26/05/2025
Volume negociado
321.89M
Pips ganhos
35.94K
Vendas
10
Instalações gratuitas
618
Imagem carregada de "Candle Volume Profile Demo"Imagem carregada de "Candle Volume Profile Demo"Imagem carregada de "Candle Volume Profile Demo"Imagem carregada de "Candle Volume Profile Demo"

This indicator visualizes the Volume Profile for individual bars, transforming standard candlesticks into a detailed 'footprint' style chart with customizable heatmaps, Point of Control (POC) lines, and Value Area blocks to highlight volume distribution per price level. It aims to emulate professional order flow tools by using heuristic volume distribution to render market activity directly on the chart.

Theoretically, this concept should work seamlessly to provide deep market insights; however, in practice, due to the immense number of graphical objects required for rendering, the more features and history depth you demand from this indicator, the more it tends to lag and cause terminal instability. :(

4.0
Avaliações: 1
5
0 %
4
100 %
3
0 %
2
0 %
1
0 %
Avaliações de clientes
November 24, 2025
Candle Volume Profile Demo gives you a clean visual of volume distribution inside candles/ranges - a smart add-on for liquidity-aware traders. The visualization is sharp and performance solid, but as a demo version it lacks full features (history logs, advanced filters). Best when paired with structure and confirmation tools. A good starting point, ready to level up.
Mais deste autor
Indicador
NAS100
Indices
Prop
+6
VolumeThermometer
Heatmap of intra-HTF volume (POC/VA) built from LTF tick data; paints current candle and auto-loads visible history.
Indicador
NAS100
NZDUSD
XAUUSD
+13
Side Volume Profile
Right-anchored cTrader Volume Profile with VAH/VAL/POC, LVZ, top volume+EMA, themes, and fast, readable visuals.
Indicador
NAS100
NZDUSD
XAUUSD
+12
VSA
Pro VSA tool with 3 modes: Fixed Ratios, Standard Deviation & Contextual VSA.
Candles_Painter
Overlay HTF context on any chart: color bars by HTF and draw filled HTF bodies with optional High/Low lines.
Moving Average Plus
10 configurable moving averages: choose type, period, color per line; single price source for all.
Indicador
NAS100
NZDUSD
Breakout
+19
Session Plus HL
Session boxes, liquidity sweeps and higher‑timeframe levels for intraday trading
Market Entropy
Market entropy + DC. Spot crystallization/chaos shifts with an optional on-chart overlay.
TrendStrengthSignals
Edge-aware clouds + Pro HUD: better entries, calmer exits, adaptive risk.
Indicador
NAS100
NZDUSD
XAUUSD
+16
Candle Timer Toolbox
A multi-TF panel with candle timers, sessions, ticker, spread & 15+ themes. Fully customizable.
Indicador
NAS100
NZDUSD
XAUUSD
+14
Donchian Channel Pro
Tracks N-period highs/lows, HTF overlay, HUDs with ADX, RSI, session clocks. Customizable for precise trading.
Também poderá gostar de
Fibonacci Pitchfan
Powerful all-in-one tool for traders seeking a clear, dynamic view of market structure. By merging pivots, trendlines &
Fx4U.Multi Trend Line Indicator
Allow trader to draw multi trendlines in different timeframes on one chart,Give trader an overview of the current market
50 percent
This indicater is a magical impact which shows exactly high and low with 100% results
Indicador
NAS100
NZDUSD
XAUUSD
+12
WT - Composite Index
Combines multiple Currency Pairs / Symbols into a single Weighted Average Strength of that currency.
Indicador
FVG
Fibonacci
Fair Value Gap (Extended)
Detect FVGs with age, status, Fibonacci levels, and customizable fill threshold—extended version.
Volume-Powered Market Flow Projector
Project market behavior by integrating price and volume data across multiple time dimensions
Market Session V3_NSC
Version 3: Full control of session display including start and end times of all 3 sessions!
Indicador
RSI
XAUUSD
Breakout
+4
S&R Structural ZigZag
"Detects swings 🎯, draws zigzag trends 📈📉, support/resistance ⏹️, labels HH/HL/LH/LL, Tracks market structure 🚀🐻."
Indicador
Scalping
ACTO-v1
ACTO: Oscillator tracking average candle duration to anticipate volatility shifts in trading.
Head Shoulders Finder
Detects Head & Shoulders patterns, plots signals, and alerts for trading opportunities.
Indicador
Indices
Stocks
Commodities
+3
HA
Pro Heikin Ashi Visual Overlay – Clean Trend Visualization
Indicador
Indices
Prop
Stocks
+5
ElliottWave
Elliott Wave Structure Pro v2.0 (Non-Repainting) Structure, Elliott, Continuation Entries
Indicador
ATR
Forex
Signal
+4
Follow Line
The Follow Line Indicator is a versatile tool designed to identify market trends and provide accurate buy/sell signals.
Zero Lag MACD
Zero Lag MACD delivers ultra-responsive trend and divergence signals with minimal lag, empowering timely Forex entries.
Indicador
RSI
MACD
sarah trend
Un indicateur tout-en-un intelligent qui détecte la tendance, donne un avis clair (achat/vente)
Indicador
Indices
Prop
Commodities
+1
Market Session
Market Session Indicator
Indicador
Indices
Prop
Commodities
+3
HMA MTF 2.0
HMA MTF 2.0 (Multi-Timeframe )
Previous Day Equilibrium (Premium & Discount)
Plots the equilibrium price levels based on previous daily highs and lows.