Descrição
📊 STVL Pro by Zofesu — Detecção de Tendência SFP & Liquidez VWAP.
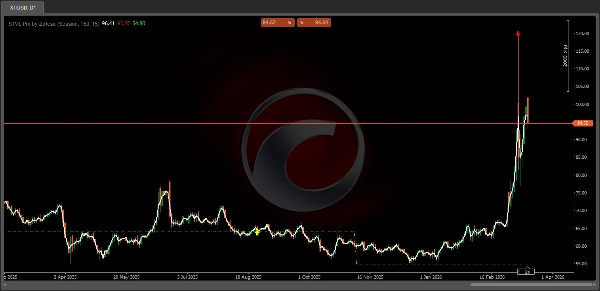
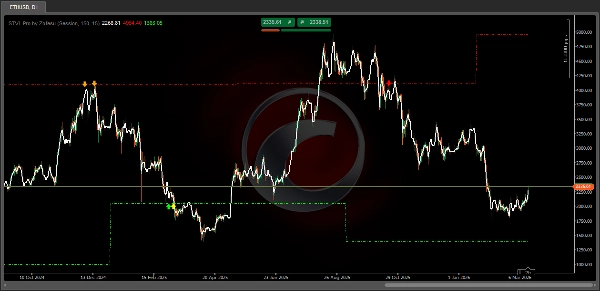
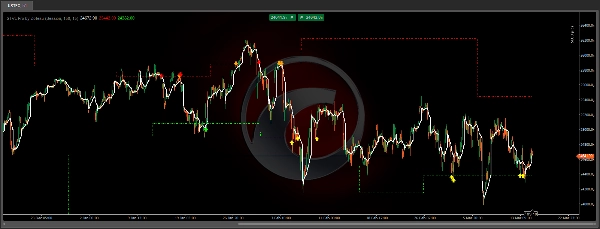
STVL Pro é um indicador de sobreposição de precisão que combina três conceitos poderosos em uma ferramenta limpa: VWAP da Sessão, níveis dinâmicos de Liquidez de Swing e detecção de sinal SFP (Padrão de Falha de Swing) em tempo real.
⚙ COMO FUNCIONA
O indicador acompanha continuamente os pontos pivôs de swing confirmados mais altos e mais baixos dentro de uma janela configurável de retrocesso. Esses níveis representam onde geralmente estão localizados os stop losses e os agrupamentos de liquidez. Quando o preço ultrapassa brevemente um desses níveis, mas fecha de volta dentro — uma varredura clássica de liquidez — o sinal SFP é acionado.
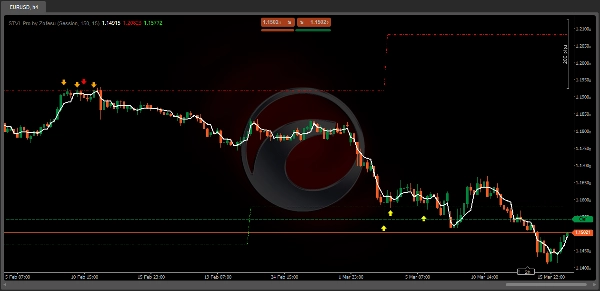
A cor do sinal conta toda a história de relance:
Seta verde (fechamento > VWAP) — reversão altista de alta convicção
Seta amarela (fechamento < VWAP) — varredura altista, mas abaixo da área de valor
Seta vermelha (fechamento < VWAP) — reversão baixista de alta convicção
Seta laranja (fechamento > VWAP) — varredura baixista, mas acima da área de valor
Nota: Os sinais na barra atual (não fechada) podem ser atualizados em tempo real conforme o preço se desenvolve — isso é intencional. Um sinal em formação indica que o mercado ainda está decidindo. A confirmação final ocorre no fechamento da barra.
🔑CARACTERÍSTICAS PRINCIPAIS
✅ VWAP Ancorado — reinicia por Sessão, Semana, Mês ou Ano
✅ Níveis Dinâmicos de Liquidez de Swing — bandas Superior e Inferior atualizadas automaticamente
✅ Detecção SFP — confirma varredura + fechamento de volta dentro do intervalo
✅ Coloração de sinal filtrada por VWAP — saiba instantaneamente se você está negociando a favor ou contra o valor
✅ Retrocesso configurável (padrão 150 barras)
✅ Zero repintura em barras confirmadas
✅ C# leve — sem impacto no desempenho
📚COMO USAR
1. Adicione o STVL Pro a qualquer gráfico e período de tempo
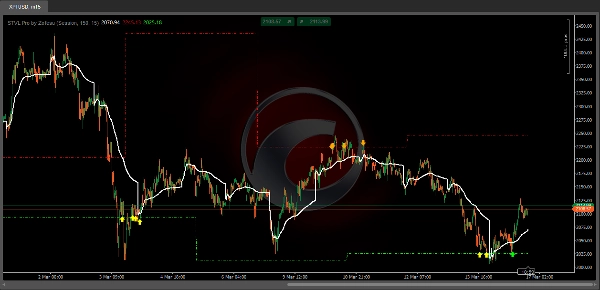
2. Observe as linhas horizontais tracejadas verdes/vermelhas — esses são seus níveis ativos de liquidez
3. Espere uma vela ultrapassar o nível e fechar de volta dentro
4. Uma seta aparece — a cor indica o nível de convicção em relação ao VWAP
5. Use como sinal independente ou combine com sua estratégia existente
Melhores resultados em: M15, H1, H4, D1
Funciona em: Índices (NAS100, SPX500), Forex, Ouro, Petróleo, Cripto
🔗PARÂMETROS
- Âncora VWAP — Sessão / Semana / Mês / Ano
- Retrocesso SFP — número de barras para definir swing alto/baixo (padrão 150)
- Deslocamento do rótulo (Pips) — distância vertical da seta em relação ao preço
⚠️ ISENÇÃO DE RESPONSABILIDADE
Negociar instrumentos financeiros envolve risco substancial de perda. O desempenho passado de qualquer indicador ou estratégia não garante resultados futuros. Esta ferramenta é fornecida apenas para fins informativos e educacionais. Sempre use gerenciamento de risco adequado e nunca arrisque mais do que pode perder. O autor não se responsabiliza por quaisquer perdas de negociação incorridas pelo uso deste indicador.