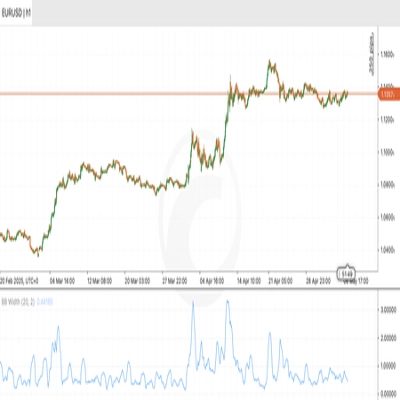
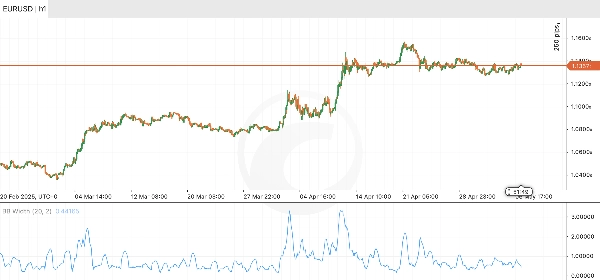
Wskaźnik
bollinger
Logo „BB Width”
BB Width
0.0
03/09/2025
14
Desktop

Indicatore di volatilità che filtra quando le bande di Bollinger sono in espansione

Da usare col mio cBot per filtrare i segnali con alta volatilità del mercato

More from this author
cBot
bollinger
commodities
xauusd
Bilbo BB Width
Strategia che unisce i rientri dalle Bande di Bollinger ed la volatilità
cBot
commodities
xauusd
Bilbo SMA Robot
Robot that enters and exits according to an SMA.
cBot
commodities
xauusd
Galvarys HA SMA
Hi! This bot is similar to my other one but it uses Heikin Ashi candles.
Możesz także polubić
vpdi
VPDI (open, close, high and low with % of the previous day and price changes in % of the previous day's close)
Wskaźnik
forex
bollinger
atr
+4
Follow Line
The Follow Line Indicator is a versatile tool designed to identify market trends and provide accurate buy/sell signals.
IR Ichimoku Macd
this indicaotr show distance between Tenkan to Kijun, Close to Kijun and Close to Tenkan 
Supply Demand Premium V2_NSC
The long awaited new and improved Supply Demand Premium V2 indicator. Unlock greater trading opportunities now!
PriceLevels
Displays the previous day's, last week's, and last month's highest and lowest price levels on your chart.
xhobaniFX_Anchored VWAP
xhobaniFX_Anchored VWAP: Volume Weighted Average
Wskaźnik
signal
TendSignal_indicator
Trend following signal
BLOCK LIQUIDITY PRO
Block Liquidity,indicator.Block Order, Liquids Stops, Signal Sentiment,signal correctio.
Wskaźnik
atr
rsi
signal
+1
Trading Fusion Bars 2
This indicator works best as a trend-confirmation tool—wait for multiple signals!
VWAP Tank Btn
Custom Vwap Indicator
Wskaźnik
forex
indices
eurusd
+1
DXY w HMA
DXY HMA Indicator
RangeBoxFibonacci
With this Fibonacci retracement indicator, traders have full control over the retracement levels displayed on the chart.
Fibonacci Prediction Channel
Designed to plot a future prediction channel based on Fibonacci retracement levels 📊
True Trend H4
It draws a step line that visualize the movement of H4. Particularly effective when trade on lower timeframe.
BWMFI_Visual
BW_MFI Vizual colors bars
EMA_RTH
Custom period EMA
Wskaźnik
indices
rsi
signal
[Stellar Strategies] MARSI Signal Plotter
🚀📈 Plot buy/sell signals on Range Bars using Moving Averages and RSI. Clear, actionable trading insights.🚀📈
Wskaźnik
breakout
btcusd
eurusd
+6
Multi-Asset Performance Matrix
Visual tool tracking financial assets' % performance across timeframes, highlighting trends with color-coded insights.