Opis
Wskaźnik TECHNICAL ANALYSIS to zaawansowane rozwiązanie analizy technicznej opracowane dla platformy cAlgo, integrujące wiele wskaźników technicznych skoncentrowanych na identyfikacji solidnych trendów, momentum rynku oraz potwierdzeniu wolumenu. Łączy ADX (Average Directional Index) z analizą nachylenia, filtrowaniem wolumenu oraz analizą techniczną w czasie rzeczywistym z wieloma wskaźnikami, oferując traderom kompleksowy i wiarygodny obraz do podejmowania decyzji.
🔍 Główna Strategia
1. Podstawa: ADX + DI (System Ruchu Kierunkowego)
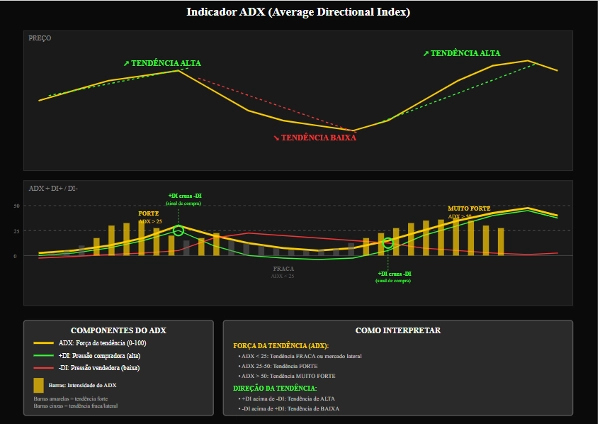
Rdzeniem wskaźnika jest ADX (Average Directional Index), który mierzy siłę trendu.
Składniki +DI (Pozytywny Wskaźnik Kierunkowy) i -DI (Negatywny Wskaźnik Kierunkowy) identyfikują kierunek trendu:
+DI > -DI → Trend wzrostowy
-DI > +DI → Trend spadkowy
2. Dynamiczna analiza momentum z nachyleniem
Nachylenie ADX, +DI i -DI jest obliczane za pomocą regresji liniowej.
Pozwala to na identyfikację, czy trend:
Zyskuje na sile (dodatnie nachylenie)
Traci na sile (ujemne nachylenie)
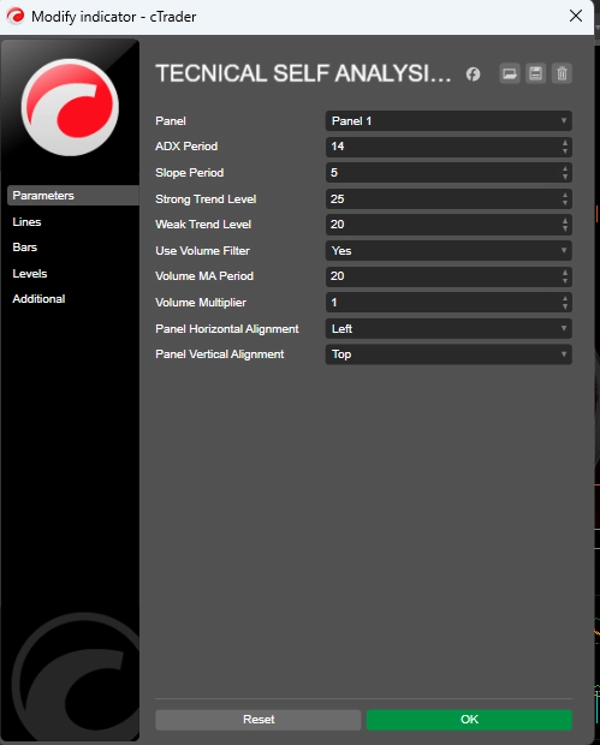
3. Poziomy odniesienia
Poziom silnego trendu: Poziom powyżej którego trend jest uważany za silny (domyślnie: 25)
Poziom słabego trendu: Minimalny poziom do uznania trendu za ważny (domyślnie: 20)
Trendy poniżej poziomu słabego są traktowane jako boczne lub bez wyraźnego kierunku.
📈 Generowanie sygnałów
Warunki kupna
✅ +DI przecina od dołu -DI
✅ ADX powyżej poziomu słabego trendu (Weak Trend Level)
✅ Dodatnie nachylenie ADX i +DI
✅ Potwierdzenie wolumenu (opcjonalne)
Warunki sprzedaży
✅ -DI przecina od dołu +DI
✅ ADX powyżej poziomu słabego trendu (Weak Trend Level)
✅ Dodatnie nachylenie ADX i -DI
✅ Potwierdzenie wolumenu (opcjonalne)
Silne sygnały: Gdy ADX jest powyżej Poziomu Silnego Trendu, a nachylenia są wyraźnie dodatnie, wskaźnik generuje wzmocnione sygnały, unikając kolejnych powtarzających się wejść. 📊 Filtr wolumenu (opcjonalny)
Wskaźnik może wymagać potwierdzenia wolumenu przed wygenerowaniem sygnałów.
Aktualny wolumen musi być większy lub równy średniej kroczącej wolumenu × mnożnik.
Pomaga to odfiltrować fałszywe wybicia i sygnały na rynkach o niskiej płynności.
🧠 Zaawansowana analiza techniczna (interaktywny panel)
TECHNICAL ANALYSIS zawiera dwa interaktywne panele na wykresie:
1. INFORMACJE O TRENDZIE
Typ trendu: Trend wzrostowy / Trend spadkowy / Trend boczny
Siła trendu: Silny / Słaby
Momentum: Wzmacniające się / Osłabiające się / Stabilne
Aktualne wartości ADX, +DI, -DI i nachylenia
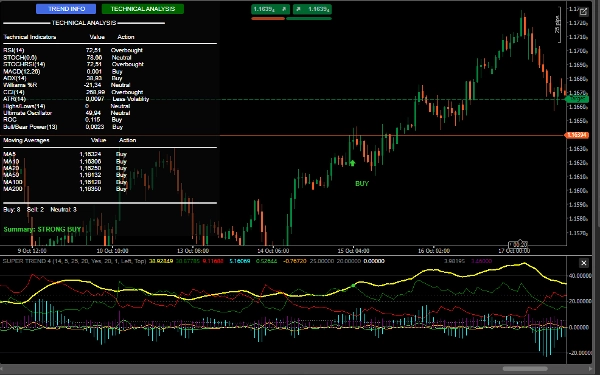
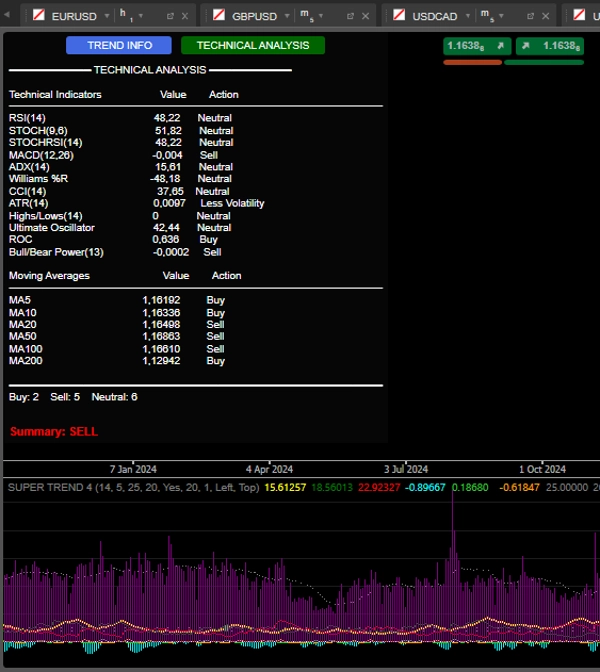
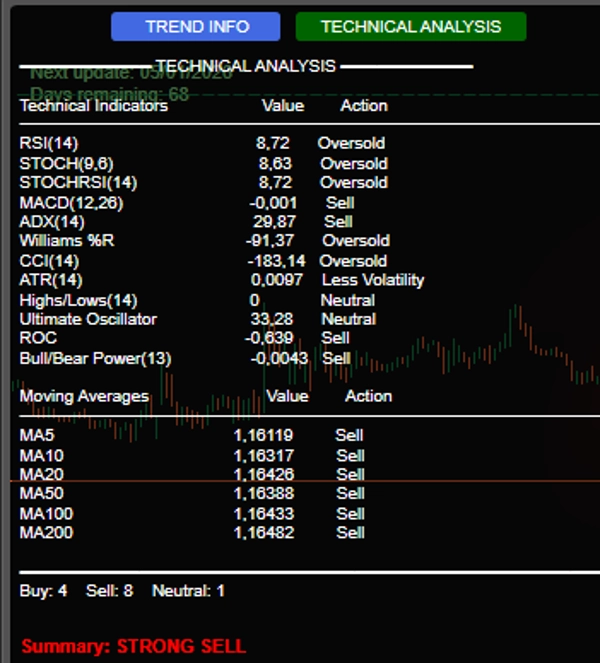
2. TECHNICAL ANALYSIS
Wykonuje analizę wielowskaźnikową w czasie rzeczywistym, w tym:
RSI(14) – Przekupienie/Przesprzedanie
Stochastic(14) – Momentum
MACD(12,26) – Przecięcia i dywergencje
Williams %R – Ekstrema rynku
CCI(14) – Odchylenia od typowej ceny
ROC(12) – Tempo zmian
Ultimate Oscillator – Potwierdzenie siły
Bull/Bear Power – Presja kupna/sprzedaży
Średnie kroczące (5,10,20,50,100,200) – Trend długoterminowy
Podsumowanie końcowe: System zlicza sygnały kupna/sprzedaży/neutralne i wydaje jasną rekomendację:
MOCNY KUPUJ (≥7 sygnałów kupna)
KUPUJ
SPRZEDAJ
MOCNY SPRZEDAJ (≥7 sygnałów sprzedaży)
NEUTRALNY
🔔 Alerty i wizualizacja
Wizualne sygnały na wykresie:
Zielone/czerwone strzałki z etykietami "BUY"/"SELL"
Powiadomienia dźwiękowe (Windows)
Szczegółowe logi w konsoli z:
Czasem sygnału
Wartościami ADX, DI i wolumenu (jeśli włączone)
🛡️ Vantagens Competitivas
✅ Integração de múltiplos indicadores em um único painel
✅ Foco na força e direção da tendência (não apenas preço)
✅ Filtro de volume para maior confiabilidade
✅ Interface interativa e informativa
✅ Sinais claros com alertas visuais e sonoros
To jest wersja testowa.