
Deskripsi
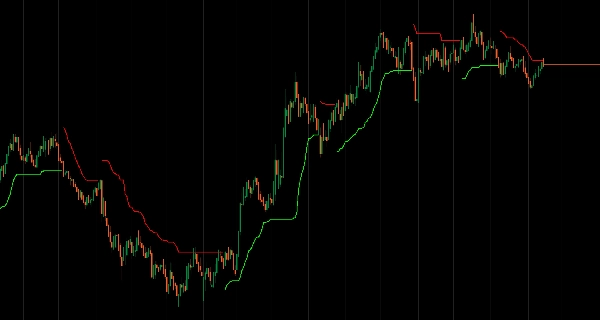
Trailing stop adaptif volatilitas yang secara otomatis menyesuaikan dengan kondisi pasar.
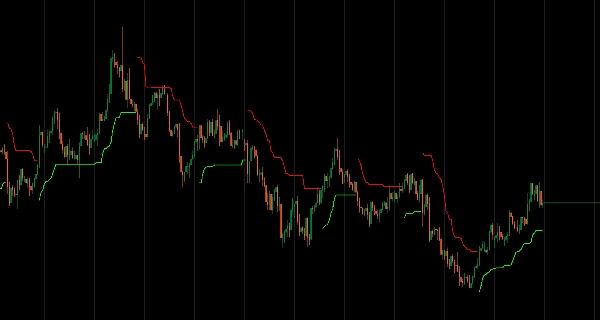
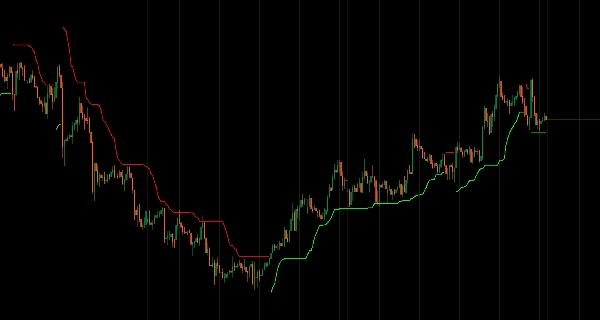
Memperlebar lebar trailing saat lonjakan volatilitas dan memperketat di pasar yang tenang menggunakan pengukuran berbasis ATR, mencegah keluar terlalu dini di pasar yang sedang tren sambil mempertahankan kedekatan selama konsolidasi.
Adaptasi volatilitas cerdas dengan perhitungan ulang waktu nyata, deteksi rezim dengan logika konfirmasi untuk menyaring sinyal palsu, memori tren yang menggabungkan momentum arah untuk ruang bernapas selama pergerakan kuat, tiga komponen adaptif (Volatility Stretch, Trend Boost, Regime Confirmation), jenis MA dan parameter sensitivitas yang dapat disesuaikan, serta tampilan visual trailing tunggal yang bersih memberikan manajemen stop dinamis bagi trader yang menargetkan tren berkelanjutan dengan kesadaran struktural.
FITUR
Adaptasi Volatilitas Cerdas
- Secara otomatis menyesuaikan lebar trailing menggunakan pengukuran volatilitas berbasis ATR
- Memperlebar trailing saat volatilitas saat ini melebihi rata-rata
- Memperketat di pasar yang tenang untuk stop yang lebih dekat
- Beradaptasi secara waktu nyata dengan kondisi pasar yang berubah
Deteksi Rezim
- Mengidentifikasi tren bull/bear dengan logika konfirmasi
- Menyaring sinyal palsu dan mengurangi whipsaw
- Memerlukan bar tertentu untuk mengonfirmasi pembalikan tren
- Identifikasi tren yang bersih tanpa gangguan
Memori Tren
- Menggabungkan momentum arah untuk memperlebar trailing selama tren kuat
- Memberi ruang bernapas selama pergerakan arah yang kuat
- Mencegah keluar terlalu dini di pasar yang sedang tren
- Menghormati struktur pasar daripada jarak sewenang-wenang
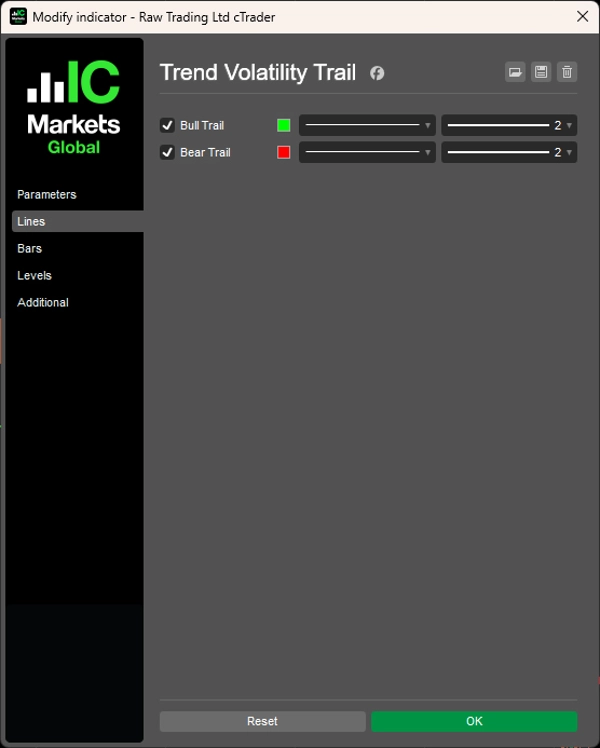
Tampilan Visual Bersih
- Menampilkan hanya trailing aktif (bull atau bear)
- Presentasi grafik yang tidak berantakan
- Konfirmasi tren visual yang jelas
- Mudah dibaca sekilas
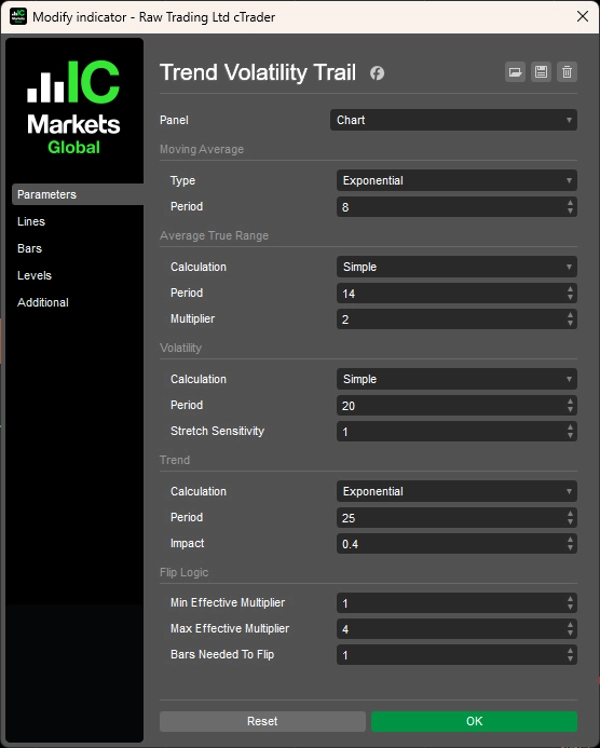
Sangat Dapat Disesuaikan
- Kontrol penuh atas jenis MA
- Parameter sensitivitas yang dapat disesuaikan
- Persyaratan konfirmasi yang dapat dikonfigurasi
- Penyesuaian halus untuk mencocokkan gaya trading Anda
Tiga Komponen Adaptif
- Volatility Stretch: Memperlebar trailing saat lonjakan volatilitas
- Trend Boost: Menambah ruang selama pergerakan kuat
- Regime Confirmation: Memvalidasi perubahan tren
Konsep dan metodologi asli diadaptasi dari indikator "Trend Following Volatility Trail" oleh HDAlgos.
__________________________________________________________________________________________
INDIKATOR GRATIS LAINNYA
Jelajahi berbagai alat analisis pasar—dari struktur dan volume hingga regresi, volatilitas, dan kerangka waktu khusus.
Kode sumber tersedia di repositori GitHub repository.
Semua gratis untuk digunakan. Tetapi jika Anda ingin mengirim dukungan kopi, Anda dapat mengarahkannya di sini.
Support/Resistance
Volume
- Volume Activity Profiler
- Volume Efficiency Analyzer
- Volume Profile Analytics
- Volume Profile - Updated
- Volume Spread Analysis
- VWAP (Volume Weighted Average Price)
Moving Averages
- SSL Channel
- Anchored Moving Average
- Deviation-Scaled Moving Average
- Gann High Low Activator
- Instantaneous Trendline
- Kaufman Adaptive MA with Trend Vision
- Moving Average Channel
- Moving Averages Suite
- Trend Channel Moving Average
Utilities/Custom
Regression-Based
Volatilitas
Osilator
__________________________________________________________________________________________
PENYANGKALAN
Perdagangan melibatkan risiko. Indikator ini dimaksudkan hanya untuk analisis teknis — selalu terapkan manajemen risiko yang tepat dan berdagang dengan bertanggung jawab.
MASUKAN & PENINGKATAN
Jika Anda memiliki saran, permintaan fitur, atau ide untuk peningkatan, silakan tinggalkan komentar di tab Diskusi. Masukan Anda membantu meningkatkan indikator untuk semua orang.
Ringkasan
Key features include real-time volatility adaptation, regime detection with confirmation logic to identify bull and bear trends and filter false signals, and trend memory that incorporates directional momentum to provide additional room during strong moves. The indicator combines three adaptive components—Volatility Stretch, Trend Boost, and Regime Confirmation—to deliver structurally aware stop management.
The visual display is streamlined, showing only the active trail (bull or bear) for clear trend confirmation without chart clutter. Users can customize moving average types, sensitivity parameters, and confirmation requirements to tailor the indicator to their trading style.
This indicator supports traders targeting sustained trends by providing dynamic, market-responsive trailing stops that respect market structure and volatility changes. It is intended for technical analysis and includes a disclaimer advising responsible trading and risk management.


