
説明
3バーリバーサル
📊 それは何ですか?
この 3バーリバーサル は、正確に3つの連続したローソク足で形成される特定の反転パターンを識別するテクニカル指標です。このクラシックなパターンは、トレンドローソク足、疲弊ローソク足、反転ローソク足という明確な視覚構造を通じて、価格方向の潜在的な変化を示します。
🎯 何のために使うのですか?
この指標はトレーダーが以下を行うのに役立ちます:
- 3本のローソク足構造による強気および弱気の反転の検出
- 誤ったシグナルのフィルタリングを設定可能なトレンド確認を通じて
- 確認されたパターンに基づくサポートおよびレジスタンスゾーンの識別
- 直感的なチャートマーカーによる取引機会の視覚化
- 任意の時間枠での高確率反転の取引
🔍 どのように機能しますか?
強気パターン(3バー強気反転)
3本のローソク足構造:
- ローソク足1(弱気):始値より終値が低い - 売り圧力を確認
- ローソク足2(疲弊した弱気):ローソク足1よりも新しい安値と高値をつけ、弱気の終値 - 降伏のシグナル ⚠️
- ローソク足3(強気の反転):始値より終値が高く、ローソク足1の高値を超える - コントロールの移行を確認 ✅
弱気パターン(3バー弱気反転)
逆の構造:
- ローソク足1(強気):始値より終値が高い - 買い圧力を確認
- ローソク足2(拡張した強気):ローソク足1よりも新しい高値と安値をつけ、強気の終値 - 過剰拡張のシグナル ⚠️
- ローソク足3(弱気の反転):始値より終値が低く、ローソク足1の安値を下回る - コントロールの移行を確認 ✅
ビジュアルマネジメントシステム(ステートマシン)
この指標は各パターンを3つの連続したフェーズで処理します:
フェーズ1 - パターン検出: 🔍
- 完全な3本のローソク足構造が識別される
- 3本目のローソク足に 三角形インジケーター(▲ 強気 / ▼ 弱気)が表示される
- 半透明のセットアップ矩形が描かれ、以下をカバーする:
-
- 強気:ローソク足1の高値から最も低い安値(ローソク足2または3)まで
- 弱気:ローソク足1の安値から最も高い高値(ローソク足2または3)まで
- この矩形は反転が起こった「戦闘ゾーン」を示す
フェーズ2 - 確認または無効化: ⏳
システムはパターンの次のローソク足を待って検証します:
強気の確認: ✅
- 次のローソク足の終値がローソク足1の高値(矩形の天井)を超える必要がある
- 確認を示す 実線の点(●) が表示される
- 矩形はアクティブなサポートゾーンになる
弱気の確認: ✅
- 次のローソク足の終値がローソク足1の安値(矩形の床)を下回る必要がある
- 確認を示す 実線の点(●) が表示される
- 矩形はアクティブなレジスタンスゾーンになる
無効化: ❌
- 強気は失敗する場合:矩形の最小値以下の終値、または弱気パターンが現れた場合
- 弱気は失敗する場合:矩形の最大値以上の終値、または強気パターンが現れた場合
- 矩形の拡張が停止する(パターンが消滅)
待機拡張: ⏸️
- 確認または失敗がない場合、矩形はローソク足ごとに水平に拡張される
フェーズ3 - アクティブなサポート/レジスタンスゾーン: 🎯
- 一度確認されると、ゾーンは右方向に無期限に拡張される
- 強気ゾーン:価格が床の上にある間はアクティブのまま
- 弱気ゾーン:価格が天井の下にある間はアクティブのまま
- 価格が完全に逆方向に突破したときにゾーンは非アクティブになる
⚙️ 主な設定
パターンモード
どのパターンのバリエーションを受け入れるかを制御します:
- ノーマル:ローソク足3がローソク足1の範囲内で終値をつけた場合のみ受け入れ
-
- 強気:終値 < ローソク足1の高値(穏やかな反転)
- 弱気:終値 > ローソク足1の安値(穏やかな反転)
- 強化:ローソク足3がローソク足1の範囲外で終値をつけた場合のみ受け入れ 🔥
-
- 強気:終値 > ローソク足1の高値(爆発的な反転)
- 弱気:終値 < ローソク足1の安値(爆発的な反転)
- すべて(推奨):両方のタイプを区別なく受け入れる ⭐
サポート/レジスタンスタイプ
- レベル:基本的なライン機能(このバージョンでは制限あり)
- ゾーン:確認後にSRゾーンを示すシェード付き矩形を描画 📦
- なし:SRゾーンなし、検出されたパターンのみ表示
カスタマイズ可能な色 🎨
- 強気反転色:三角形、矩形、強気ゾーン用(デフォルト:
#2962FF- 青) - 弱気反転色:三角形、矩形、弱気ゾーン用(デフォルト:
#FF9800- オレンジ) - 強気トレンド色:トレンドフィルターの視覚化用(デフォルト:
#089981- 緑) - 弱気トレンド色:トレンドフィルターの視覚化用(デフォルト:
#F23645- 赤)
🔧 トレンドフィルター
この指標は全体のトレンド方向に基づいてパターンをフィルタリングできます。4つの方法があります:
1. 移動平均クラウド ☁️
2つの移動平均を使用してトレンドを識別:
パラメータ:
- 移動平均タイプ:単純、指数、ハル、加重など(デフォルト:ハル)
- 高速期間:50(デフォルト)
- 低速期間:200(デフォルト)
フィルターロジック(整合):
- 強気トレンド検出時:価格 > 高速MA かつ 高速MA > 低速MA ✅
- 弱気トレンド検出時:価格 < 高速MA かつ 高速MA < 低速MA ✅
- 強気トレンドでは強気パターンのみ、弱気トレンドでは弱気パターンのみ表示
逆ロジック(反対):
- 条件を反転させて主要な逆トレンド反転を捉える
2. スーパー・トレンド 📈
ボラティリティベースのトレンド追従指標(ATR):
パラメータ:
- ATR期間:10(デフォルト) - ボラティリティ計算ウィンドウ
- 乗数係数:3.0(デフォルト) - 指標の感度
ロジック:
- ATRを使って上限バンドと下限バンドを計算
- 価格がスーパー・トレンドの上にある = 強気トレンド 🟢
- 価格がスーパー・トレンドの下にある = 弱気トレンド 🔴
- 設定された整合に従ってパターンをフィルタリング
3. ドンチャンチャネル 📊
一定期間の価格の極値を使用:
パラメータ:
- チャネル長:13(デフォルト)
ロジック:
- 上チャネル = N期間の最高高値
- 下チャネル = N期間の最安値
- 中点 = (上チャネル + 下チャネル)/ 2
- 価格が中点より上 = 強気トレンド 🟢
- 価格が中点より下 = 弱気トレンド 🔴
4. なし(フィルターなし) 🔓
全ての検出された3バーのパターンを全体のトレンドを考慮せずに表示します。以下に有用です:
- レンジ相場
- 純粋なパターン分析
- あらゆる文脈での反転取引
トレンド整合
フィルターが有効な場合に適用:
- 整合:識別されたトレンドに沿ったパターンのみ表示 ➡️
-
- 強気トレンドでは強気パターンのみ
- 弱気トレンドでは弱気パターンのみ
- 逆:識別されたトレンドに逆らうパターンのみ表示 🔄
-
- 弱気トレンドでの強気パターン(主要な反転)
- 強気トレンドでの弱気パターン(主要な反転)
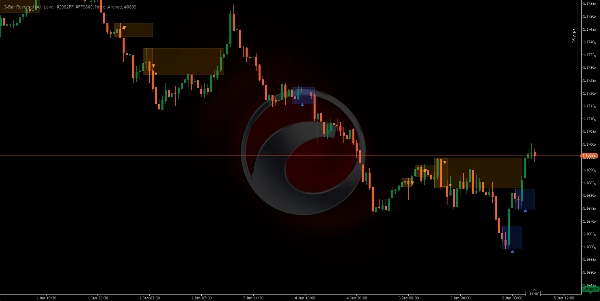
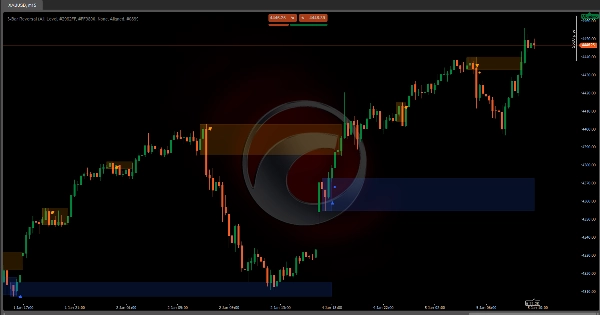
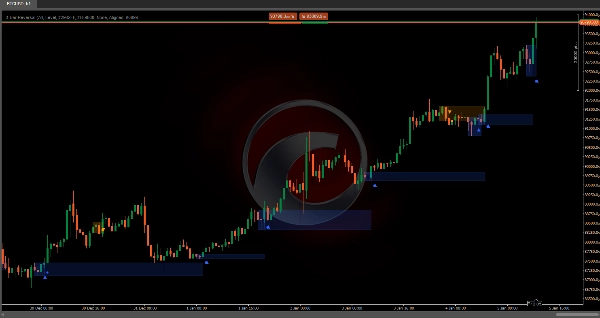
概要
It operates in three phases: pattern detection, confirmation or invalidation based on the next candle's behavior, and establishing active support or resistance zones that extend while price respects them. The indicator supports configurable pattern modes (Normal, Enhanced, or All) to control acceptance criteria for reversals.
Trend filtering is available through four methods—Moving Average Cloud, Supertrend, Donchian Channels, or no filter—allowing users to align pattern signals with overall market trends or capture counter-trend reversals. Confirmed reversal zones are displayed as shaded rectangles or levels, customizable in color for bullish and bearish signals, trend filters, and zones.
This tool is designed for use on any timeframe and across various markets, including forex pairs (EURUSD, GBPUSD, USDJPY, NZDUSD), commodities (XAUUSD), indices (NAS100), and cryptocurrencies (BTCUSD). It aids traders in detecting high-probability reversals, filtering false signals, and identifying support and resistance zones with clear visual markers.


