
TradingViewMACD
インジケーター
3 購入済
バージョン 1.0、Feb 2025
Windows、Mac
5.0
レビュー: 1

説明
TradingViewMACDインジケーター
cAlgoプラットフォーム向けに設計された高度にカスタマイズ可能なTradingViewMACDインジケーターで、トレーディング戦略を向上させましょう。この強力なツールは、市場分析を最適化するために必要な柔軟性と精度を兼ね備えています。
主な特徴:
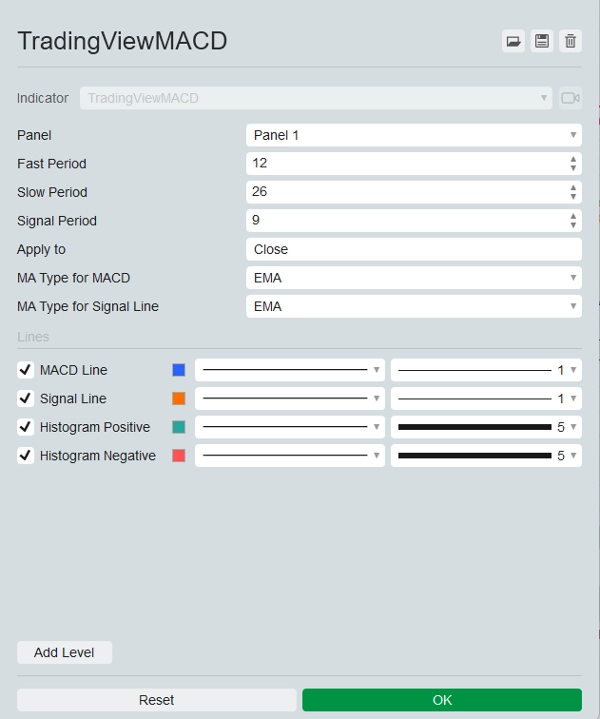
- カスタマイズ可能なパラメーター:
-
- ファスト期間:トレーディングスタイルに合わせてファスト移動平均期間を調整します。
- スロー期間:信号の精度を高めるためにスロー移動平均期間を設定します。
- シグナル期間:エントリーおよびエグジットポイントを微調整するためにシグナルライン期間を設定します。
- 適用価格:オープン、高値、安値、終値、中央値、典型値、加重価格から選択してインジケーターを適用します。
- 複数の移動平均タイプ:
-
- MACDラインとシグナルラインの両方に対して、単純移動平均(SMA)と指数移動平均(EMA)を選択でき、分析の柔軟性を提供します。
- 視覚的出力:
-
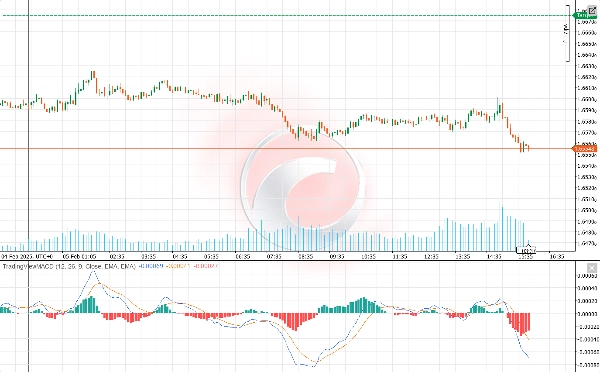
- MACDライン:鮮やかな青色で表示され、明確に視認できます。
- シグナルライン:鮮やかなオレンジ色で強調表示され、MACDラインと簡単に区別できます。
- ヒストグラム:正の値と負の値をそれぞれ緑色と赤色で区別し、市場の勢いを明確に視覚化します。
- 強化された市場洞察:
-
- インジケーターはファスト移動平均とスロー移動平均の差を計算してMACDラインを生成します。
- MACDラインの移動平均としてシグナルラインを計算します。
- ヒストグラムはMACDラインとシグナルラインの差を視覚的に表現し、潜在的な買いおよび売りシグナルの識別を支援します。
- ユーザーフレンドリー:
-
- インストールと設定が簡単で、あらゆるレベルのトレーダーが高度な機能を活用できます。
- 包括的なドキュメントとカスタマーサポートにより、スムーズな体験を保証します。
TradingViewMACDインジケーターでトレーディング戦略の可能性を最大限に引き出しましょう。市場分析を強化し、情報に基づいた意思決定を行い、この必須のトレーディングツールで先を行きましょう。
概要
AIによる概要
The TradingViewMACD indicator for the cAlgo platform is a customizable technical analysis tool designed to enhance market analysis. It calculates the difference between fast and slow moving averages to generate the MACD line, computes a signal line as the moving average of the MACD line, and displays a histogram representing the difference between these lines to help identify potential buy and sell signals.
Key features include adjustable parameters such as fast period, slow period, signal period, and applied price (open, high, low, close, median, typical, or weighted). Users can select between Simple Moving Average (SMA) and Exponential Moving Average (EMA) types for both the MACD and signal lines, providing analytical flexibility.
Visual outputs consist of a blue MACD line, an orange signal line, and a histogram with green and red colors indicating positive and negative momentum, respectively. The indicator is designed for ease of installation and configuration, supported by comprehensive documentation and customer support to accommodate traders of all experience levels.
インジケーターのプロフィール
カスタマーレビュー
5.0
レビュー: 1
5 | 100 % | |
4 | 0 % | |
3 | 0 % | |
2 | 0 % | |
1 | 0 % |
カスタマーレビュー
November 9, 2025
TradingView MACD brings the familiar feel straight to cTrader 🚀 - smooth, light, and 100% accurate to the original. Perfect for traders switching from TV who love clean momentum signals. Missing alerts, but flawless for classic trend and divergence play.
ディスカッション
よくあるご質問
Signal
MACD
cTrader Storeで入手可能な取引ボット、インジケーター、プラグインなどの商品は、第三者の開発者が提供するものであり、情報と技術の取得のみを目的としてご利用いただけます。cTrader Storeはブローカーではなく、投資助言や個人的な推奨を行うことも、将来のパフォーマンスを保証することもありません。


価格
登録日 22/11/2024
133
販売
2.58K
無料インストール