
Head Shoulders Finder
Indicador
447 transferências
Versão 1.0, May 2025
Windows, Mac
5.0
Avaliações: 1
Descrição
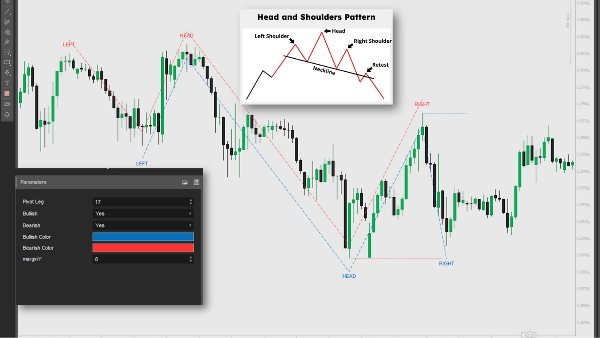
Este indicador identifica padrões de Cabeça e Ombros e Cabeça e Ombros Invertidos ao analisar os pontos altos e baixos pivôs nos dados de preço. Ele traça linhas, rótulos e sinais para potenciais reversões de tendência, acionando condições de venda quando o preço cruza abaixo da linha do pescoço (baixa) ou condições de compra quando acima (alta). Os traders podem usar esses sinais para entrar em posições vendidas ou compradas, combinando com outras análises e gerenciamento de risco para otimizar estratégias de negociação.
Resumo
Resumo de IA
The Head Shoulders Finder is a technical indicator designed to detect Head and Shoulders and Inverted Head and Shoulders chart patterns by analyzing pivot highs and lows in price data. It visually marks these patterns with lines and labels on the price chart, highlighting potential trend reversal points. The indicator generates trading signals by identifying when the price crosses the neckline: a break below signals a bearish trend reversal suitable for short positions, while a break above indicates a bullish reversal for long positions. Traders can use these signals alongside other technical analyses and risk management strategies to inform entry decisions. This tool supports pattern recognition and signal plotting to assist in identifying potential trading opportunities based on classic reversal formations.
Perfil do indicador
Avaliações de clientes
5.0
Avaliações: 1
5 | 100 % | |
4 | 0 % | |
3 | 0 % | |
2 | 0 % | |
1 | 0 % |
Avaliações de clientes
August 18, 2025
Automatically detects Head & Shoulders patterns, customizable visuals. Cons: No pattern reliability filter, no alerts, false signals on low TFs.
Conversa
Perguntas frequentes
Os produtos disponíveis através da cTrader Store, incluindo bots de negociação, indicadores e plugins, são fornecidos por programadores terceiros e são disponibilizados apenas para fins informativos e de acesso técnico. A cTrader Store não é um corretor e não fornece aconselhamento em matéria de investimento, recomendações pessoais ou qualquer garantia de desempenho no futuro.
Mais deste autor


![Logótipo de "[Stellar Strategies] Inside Bar with Signals"](https://cdn.ctrader.com/image/webp/1d9e8bfa-3b2c-4440-bb37-5856902008a7_30683)
Preço
86.53M
Volume negociado
1.97M
Pips ganhos
3.65K
Instalações gratuitas