
Descrição
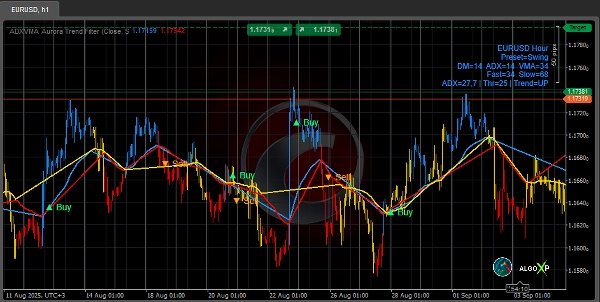
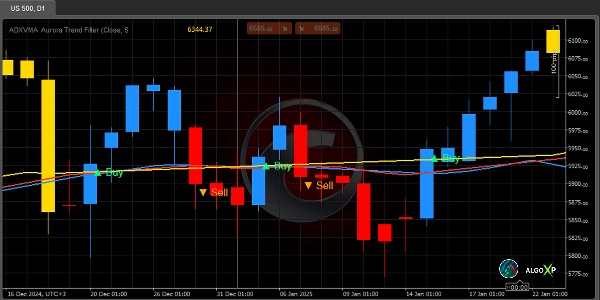
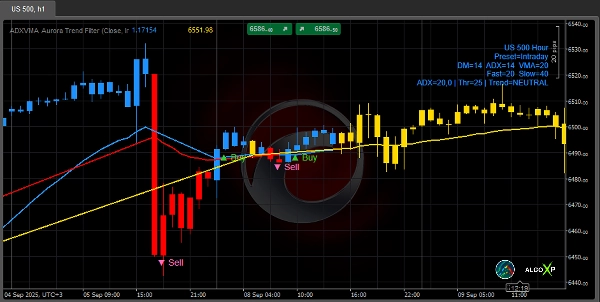
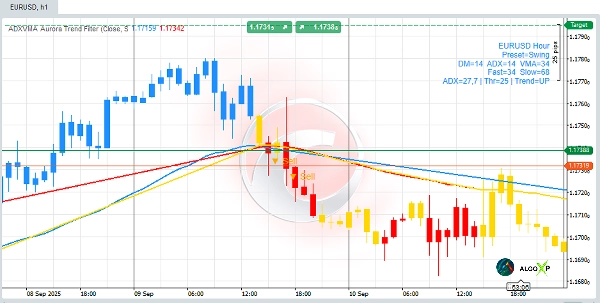
⚡ Filtro de Tendência ADXVMA Aurora combina força da tendência ADX com uma mistura adaptativa de EMA para formar uma linha base de negociação confiável. Diferente dos indicadores comuns com suavização fixa, o Aurora ajusta em tempo real—mais próximo do preço em tendências fortes, mais suave em intervalos—e exibe uma clara tendência Alta / Baixa / Neutra com setas de cruzamento opcionais. O resultado é mais responsividade que MAs estáticas e mais estabilidade que o ADX sozinho.
🆚 Por que é mais forte que indicadores comuns
- Em comparação com MAs fixas: o coeficiente adaptativo reduz o atraso em tendências e filtra oscilações em intervalos.
- Em comparação com ADX bruto: transforma a força em uma linha base negociável (com cores e sinais de cruzamento), não apenas um número.
- Em comparação com filtros genéricos: uma EMA rápida/lenta ponderada pelo ADX oferece uma mistura equilibrada de sensibilidade e estabilidade.
🧠 O motor: mistura de EMA ponderada pelo ADX
ADX (0…100) mede a força da tendência. Aurora mistura uma EMA rápida e uma EMA lenta, usando o ADX como peso:
- ADX alto → tendência para rápida (menor atraso).
- ADX baixo → tendência para lenta (melhor filtragem de ruído).
A linha é codificada por cor conforme a inclinação (e pode ser neutra quando o ADX é fraco), resultando em uma leitura clara Azul / Vermelho / Amarelo.
🔭 O que faz
- Linha base adaptativa: mistura EMA rápida e lenta usando ADX como peso.
- Cores de três estados: Azul (Alta), Vermelho (Baixa), Amarelo (Neutro).
- Barras coloridas: coloração das velas para contexto instantâneo.
- Setas de cruzamento: modos Por Tendência (Clássico) ou Todos os Cruzamentos (Simples).
- Painel de controle: períodos ao vivo, ADX e estado da tendência.
- Pronto para bots: série oculta TrendState (−1/0/+1) e ADX para cBots/scanners.
🎯 Como negociar
- Tendência: Acima da linha + azul → foco em compras; abaixo da linha + vermelho → foco em vendas; amarelo → aguarde.
- Entrada: pegue a seta no cruzamento do preço com a linha base (escolha Por Tendência ou Todos os Cruzamentos).
- Saída: pare na linha Aurora ± buffer; realize lucro via RR≥2 ou no cruzamento/oposição de cor.
🚀 Predefinições (início rápido)
- Scalp: VMA=12 · ADX=14 · ADX-Thr=28 · InclinaçãoNeutra=0.04 · Link=VMA→2×VMA
- Intraday: VMA=20 · ADX=14 · ADX-Thr=25 · InclinaçãoNeutra=0.06 · Link=VMA→2×VMA
- Swing: VMA=34 · ADX=14 · ADX-Thr=23 · InclinaçãoNeutra=0.10 · Link=VMA→2×VMA
- Posição: VMA=55 · ADX=14 · ADX-Thr=20 · InclinaçãoNeutra=0.15 · Link=VMA→2×VMA
🔧 Parâmetros chave
- Períodos DM / ADX / VMA (separados, estilo Wilder).
- Usar DM genuíno (Wilder): +DM/−DM estrito (recomendado Ligado).
- Link de adaptação: Link para VMA (Rápida=VMA, Lenta≈2×VMA) ou Manual Rápida/Lenta.
- Inclinação Neutra (pips): sensibilidade da inclinação por barra.
- Plano se ADX < Limiar: força Neutro durante tendência fraca (Ligado/Desligado).
- Setas / Barras Coloridas / Painel: ligado/desligado; Modo de Seta: Por Tendência / Todos os Cruzamentos.
🎯 Perfeito para:
- Scalpers, traders intraday e swing que desejam um filtro de tendência claro + gatilhos simples
- Traders algorítmicos que precisam de séries estáveis e legíveis por máquina.
🧭 Dicas de Timeframe & Mercado
- TFs menores (M1–M5): mais ruído → comece com VMA 10–14, InclinaçãoNeutra 0.04–0.08, Limiar ADX 25–30.
- Intraday (M15–H1): VMA 18–24, InclinaçãoNeutra 0.06–0.12, Limiar ADX 22–28.
- TFs maiores (H4–D1): VMA 30–60, InclinaçãoNeutra 0.10–0.25, Limiar ADX 20–25.
- Principais vs. Voláteis (XAU, Cripto): aumente VMA / InclinaçãoNeutra / Limiar um nível para mercados voláteis.
Resumo
The core mechanism uses ADX (0–100) to weight a fast and slow EMA: high ADX values favor the fast EMA for responsiveness, while low ADX values favor the slow EMA for stability. This approach delivers more responsiveness than static moving averages and greater stability than ADX alone.
Key features include candle color bars for instant trend context, a dashboard showing live periods and trend states, and hidden series outputs (TrendState and ADX) suitable for algorithmic trading and scanners. It supports multiple preset configurations for scalping, intraday, swing, and position trading, with adjustable parameters for trend detection sensitivity and noise filtering.
The indicator is applicable across various markets including Forex, indices, commodities, stocks, and cryptocurrencies, and is designed for use on multiple timeframes from one minute to daily charts. It is suitable for traders seeking a clear trend filter with simple triggers and for algo traders requiring stable, machine-readable signals.
Avaliações de clientes
5 | 33 % | |
4 | 67 % | |
3 | 0 % | |
2 | 0 % | |
1 | 0 % |


