Opis
Solidny wskaźnik delta skumulowana i nierównowagi.
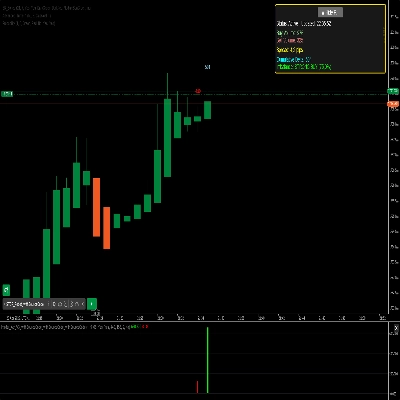
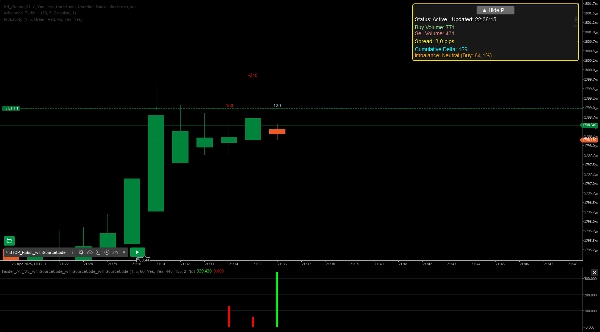
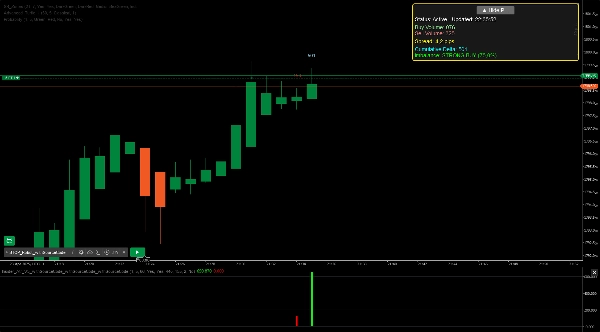
Insider to solidny wskaźnik cTrader zaprojektowany do analizy danych głębokości rynku i wyróżniania nierównowag kupna i sprzedaży w czasie rzeczywistym. Zapewnia wyraźną wizualną informację zwrotną na wykresie, wyświetlając kluczowe metryki, takie jak wolumen kupna/sprzedaży, delta skumulowana oraz siła nierównowagi za pomocą histogramów i konfigurowalnego panelu. Dostosuj go do swojego stylu handlu dzięki regulowanym ustawieniom, w tym okresowi wyświetlania, poziomom głębokości (1-10) oraz progowi nierównowagi wolumenu (50-95%). Dodatkowe funkcje obejmują opcjonalne alerty dla silnych nierównowag, filtrowanie godzin handlu oraz panel o zmiennym rozmiarze dla lepszej użyteczności. Idealny dla day traderów i swing traderów, ten wskaźnik oferuje cenne informacje o nastrojach rynkowych i potencjalnych ruchach cen.
Podsumowanie
Opinie klientów
5 | 100 % | |
4 | 0 % | |
3 | 0 % | |
2 | 0 % | |
1 | 0 % |


![Logo „[CB] Pivot Points Pro”](https://cdn.ctrader.com/image/webp/43463c82-67b0-4f10-a4ba-901bba091d81_32594)


