
Compare Symbol
Wskaźnik
200 pobrania
Wersja 1.0, May 2025
Windows, Mac
Opis
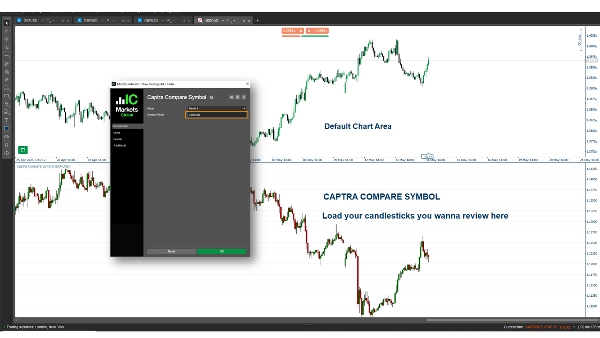
Captra Compare Symbol to wskaźnik cTrader, który wyświetla cenę zamknięcia i rysuje świece (knot, korpus) dla wybranego symbolu, takiego jak EURUSD, na wykresie. Obsługuje różne ramy czasowe (np. 5M, 15M, 1H, Daily) z możliwością dostosowania wizualnego, wykorzystując ceny otwarcia/zamknięcia/maksimum/minimum dla dokładnej reprezentacji.
Podsumowanie
Podsumowanie AI
Captra Compare Symbol is a cTrader indicator that visualizes price data of a selected trading symbol, such as EURUSD, directly on the chart. It plots the close price and renders candlesticks—including wicks and bodies—using open, high, low, and close prices for precise representation. The indicator supports multiple timeframes, including 5-minute, 15-minute, 1-hour, and daily intervals. Visual elements are customizable to fit user preferences. This tool enables traders to compare the price action of an additional symbol alongside their primary chart, facilitating multi-symbol analysis within the cTrader platform.
Profil wskaźnika
Opinie klientów
0.0
Opinie: 0
Opinie klientów
Ten produkt nie ma jeszcze opinii. Wypróbowałeś(-aś) go już? Bądź pierwszy(-a) i powiedz o tym innym!
Dyskusja
Częste pytania
EURUSD
Produkty dostępne za pośrednictwem cTrader Store, w tym boty handlowe, wskaźniki i wtyczki, dostarczane są przez deweloperów zewnętrznych i udostępniane wyłącznie w celach informacyjnych oraz w celu zapewnienia dostępu technicznego. cTrader Store nie jest brokerem i nie zapewnia doradztwa inwestycyjnego, nie udziela spersonalizowanych rekomendacji ani nie gwarantuje przyszłych wyników.
Więcej od tego autora


Cena
86.67M
Wolumen transakcji
1.99M
Zysk w pipsach
3.67K
Bezpłatne instalacje