
Opis
Przedstawiamy Stochastic RSI PRO dla cTrader, zaawansowaną wersję wskaźnika Stochastic RSI zaprojektowaną, aby zwiększyć precyzję Twojego handlu.
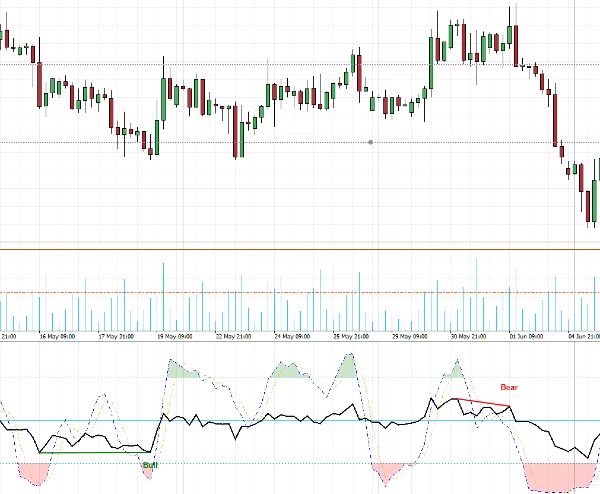
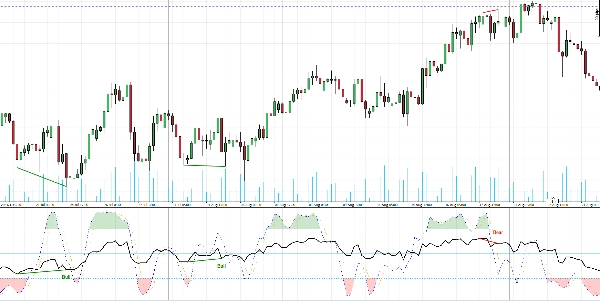
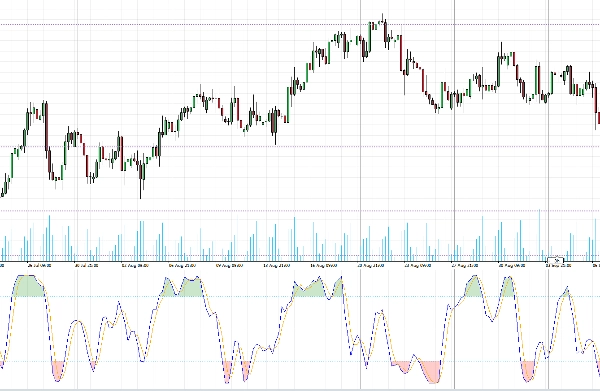
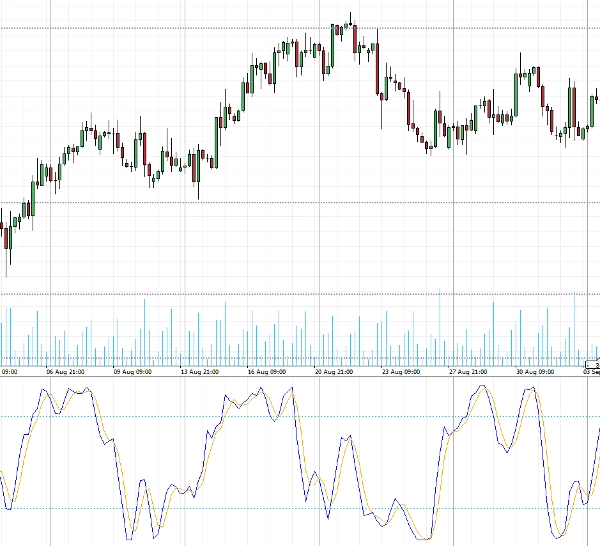
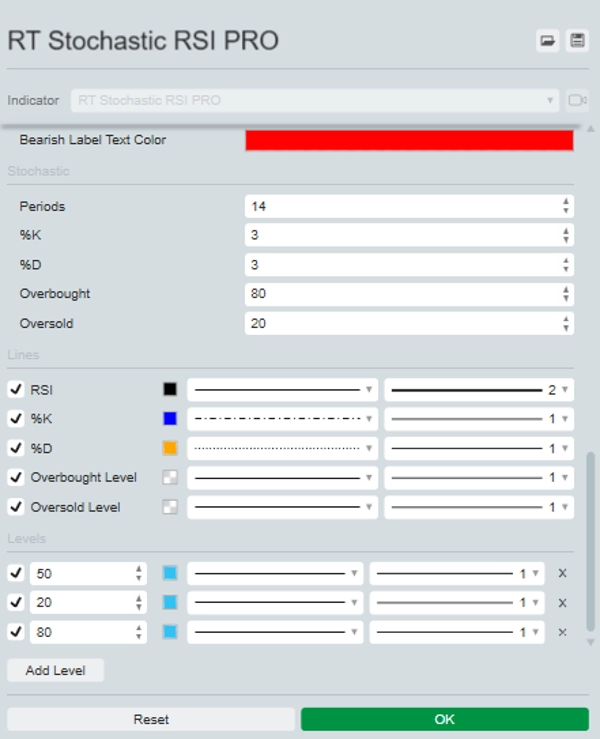
To potężne narzędzie nakłada RSI bezpośrednio na Stochastic RSI, zapewniając kompleksowy obraz momentum rynku. Wyróżnia obszary wykupienia i wyprzedania za pomocą wyraźnego kolorowania dla łatwej identyfikacji.
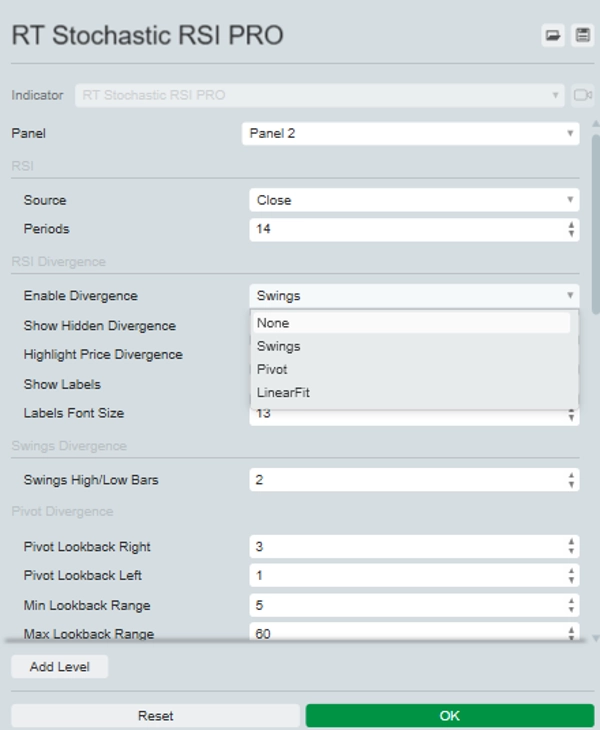
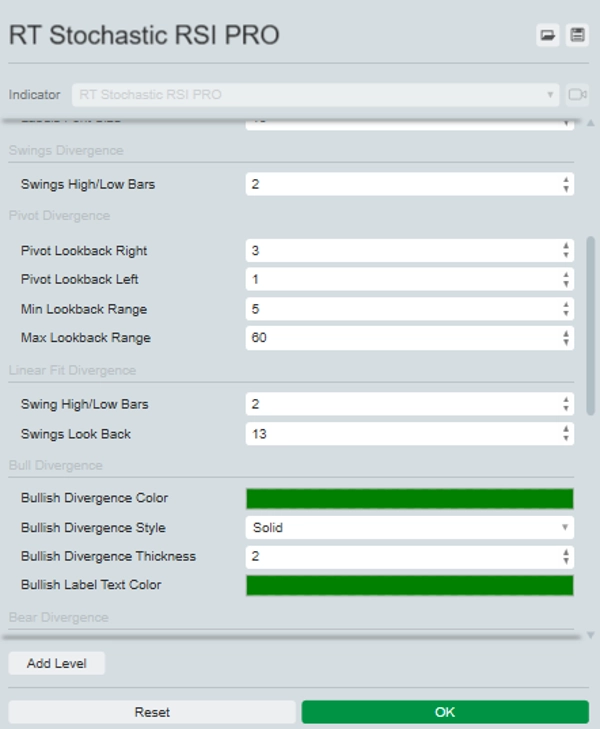
Najważniejszą cechą Stochastic RSI PRO jest jego zdolność do identyfikowania i opcjonalnego wyróżniania zarówno zwykłych, jak i ukrytych dywergencji na wykresie. Możesz wybrać spośród trzech metod identyfikacji dywergencji: Swing, Pivot lub Linear Fit, każda z konfigurowalnymi ustawieniami dopasowanymi do Twojej strategii handlowej.
Podnieś swoją analizę i podejmowanie decyzji dzięki Stochastic RSI PRO, niezbędnemu narzędziu dla wymagających traderów.
![Logo „[Hamster-Coder] Bollinger Bands”](https://cdn.ctrader.com/image/webp/21d8e5d6-fb11-4bac-b9ee-cd05c2b76804_30327)


![Logo „Smart Money Concepts (SMC) [Iridio Capital]”](https://cdn.ctrader.com/image/webp/28b69fd1-ef54-4bed-9487-07e78e883be4_40934)
