
Compare Symbol
อินดิเคเตอร์
198 ดาวน์โหลด
เวอร์ชัน 1.0, May 2025
Windows, Mac
คำอธิบาย
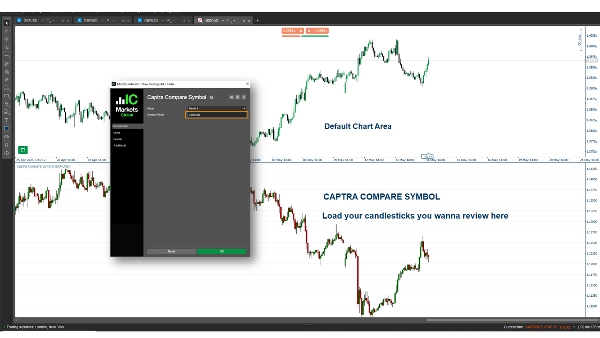
Captra Compare Symbol เป็นตัวบ่งชี้ cTrader ที่แสดงราคาปิดและวาดแท่งเทียน (ไส้เทียน, ตัวแท่ง) สำหรับสัญลักษณ์ที่เลือก เช่น EURUSD บนแผนภูมิ รองรับกรอบเวลาต่างๆ (เช่น 5M, 15M, 1H, รายวัน) พร้อมการปรับแต่งภาพที่กำหนดเอง โดยใช้ราคาปิด/เปิด/สูง/ต่ำเพื่อการแสดงผลที่แม่นยำ
สรุป
สรุปโดย AI
Captra Compare Symbol is a cTrader indicator that visualizes price data of a selected trading symbol, such as EURUSD, directly on the chart. It plots the close price and renders candlesticks—including wicks and bodies—using open, high, low, and close prices for precise representation. The indicator supports multiple timeframes, including 5-minute, 15-minute, 1-hour, and daily intervals. Visual elements are customizable to fit user preferences. This tool enables traders to compare the price action of an additional symbol alongside their primary chart, facilitating multi-symbol analysis within the cTrader platform.
โปรไฟล์อินดิเคเตอร์
รีวิวจากลูกค้า
0.0
รีวิว: 0
รีวิวจากลูกค้า
ยังไม่มีรีวิวสำหรับผลิตภัณฑ์นี้ หากเคยลองแล้ว ขอเชิญมาเป็นคนแรกที่บอกคนอื่น!
การสนทนา
คำถามที่พบบ่อย
EURUSD
ผลิตภัณฑ์ที่มีให้บริการผ่าน cTrader Store รวมถึงบอทการเทรด อินดิเคเตอร์ และปลั๊กอิน มีให้บริการโดยนักพัฒนาบุคคลที่สามและมีไว้เพื่อวัตถุประสงค์ในการเข้าถึงข้อมูลและทางเทคนิคเท่านั้น cTrader Store ไม่ใช่โบรกเกอร์และไม่ได้ให้คำแนะนำการลงทุน คำแนะนำส่วนบุคคล หรือการรับประกันผลการดำเนินงานในอนาคต
เพิ่มเติมจากผู้เขียนคนนี้


ราคา
86.45M
ปริมาณการเทรด
1.97M
Pips ที่ได้กำไร
3.64K
ติดตั้งฟรี