
คำอธิบาย
Price Jump Exit and Re-entry (PjER ) Indicator เป็นตัวชี้วัดการจัดการความเสี่ยงที่อิงตามบทความทางวิชาการ “A dynamic price jump exit and reentry strategy for intraday trading” โดย Koegelenberg & van Vuuren (2024), ตีพิมพ์ในวารสาร Expert Systems With Applications.
นวัตกรรมหลัก
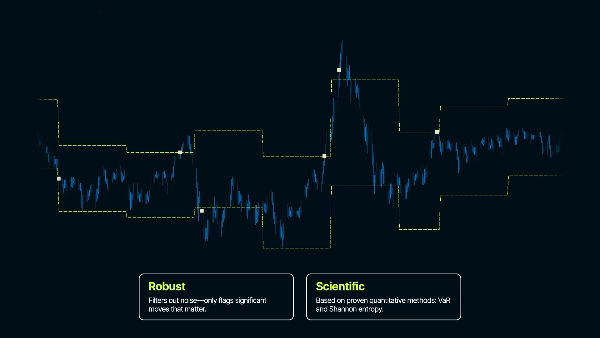
- การประเมิน VaR ของความสูญเสียที่อาจเกิดขึ้นก่อนที่จะเกิดขึ้นจริง
- ความทนทานต่อแนวโน้มตลาดที่แข็งแกร่งในช่วงเวลาสั้นๆ
- การวิเคราะห์การแก้ไขตลาดหลังจากการกระโดดราคาเพื่อกำหนดเวลาการเข้าซื้อใหม่อย่างปลอดภัย
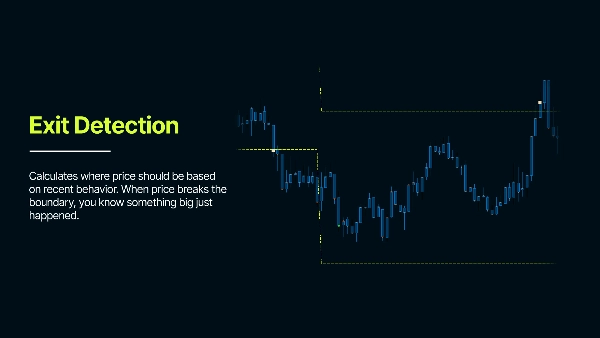
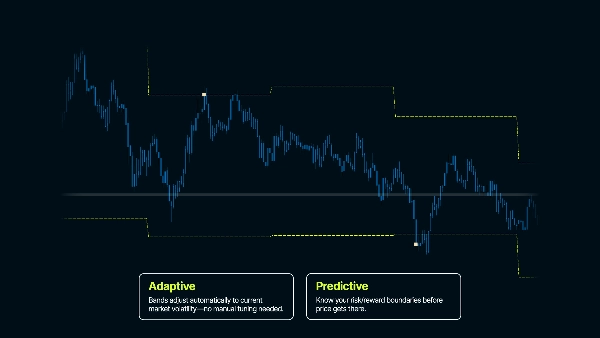
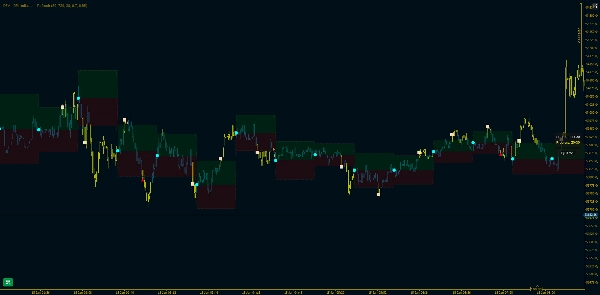
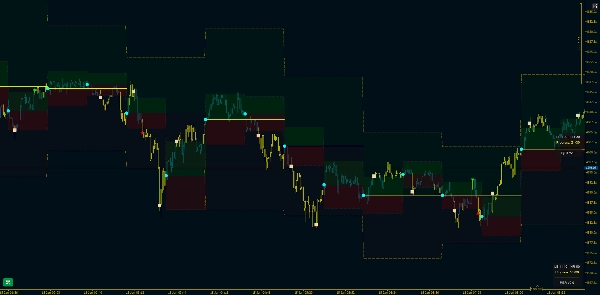
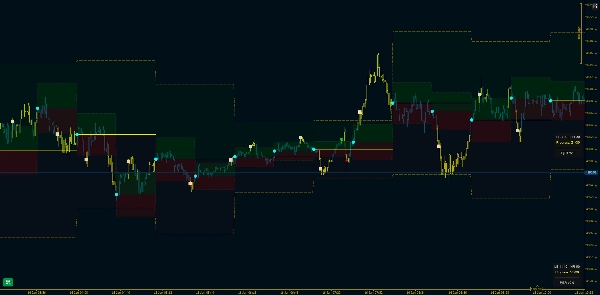
มันวิเคราะห์การเคลื่อนไหวของราคาที่ผ่านมาเพื่อเข้าใจความผันผวนทั่วไปและสร้างช่วงความเชื่อมั่น - ซึ่งแสดงถึง ช่วงราคาที่คาดหวัง เมื่อราคากระโดดออกนอกช่วงเหล่านี้จะเป็นสัญญาณว่ามีบางอย่างผิดปกติเกิดขึ้น
กรณีการใช้งานเป้าหมาย
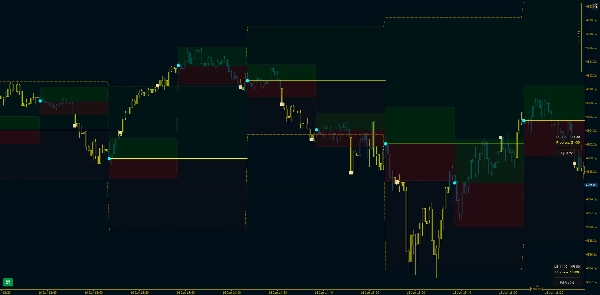
การซื้อขายภายในวัน (โดยเฉพาะกลยุทธ์ที่อิงตามช่วงราคา) ตัวชี้วัดนี้สร้างขอบเขตทางสถิติรอบราคาสำหรับตรวจจับการเคลื่อนไหวของราคาที่ผิดปกติ ในพฤติกรรมตลาดปกติราคาจะอยู่ภายในช่วงที่คาดหวังตามความผันผวนล่าสุด เมื่อราคาทะลุช่วงเหล่านี้ จะเป็นสัญญาณว่ามีบางอย่างผิดปกติเกิดขึ้น - จุดออกจากการซื้อขายที่เป็นไปได้ หรือการเบรคเอาท์ในโครงสร้างตลาด เนื่องจากพฤติกรรมตลาดเปลี่ยนไป
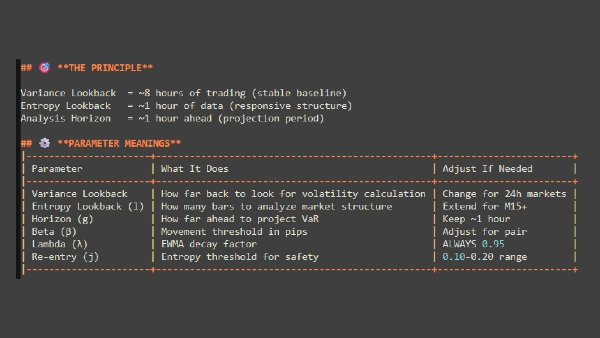
คำอธิบายพารามิเตอร์หลัก
Max Days Back - กำหนดระยะเวลาย้อนหลังที่ตัวชี้วัดเริ่มทำงาน
GMT Offset - ปรับเวลาตามโซนเวลาของคุณ เพื่อให้การคำนวณวันที่ตรงกับเวลาท้องถิ่น
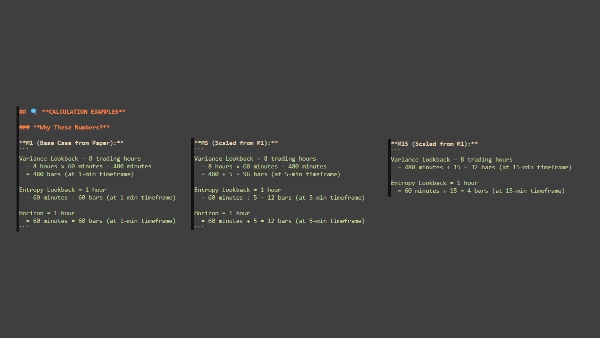
Lookback Period (bars)
"ฉันควรใช้ประวัติราคาย้อนหลังเท่าไหร่เพื่อวัดพฤติกรรม 'ปกติ'?"
- จำนวนแท่งข้อมูลประวัติที่ใช้ในการคำนวณความผันผวน
- แท่งมาก = เสถียรมากขึ้นแต่ปรับตัวช้า; แท่งน้อย = ตอบสนองเร็วแต่มีเสียงรบกวนมากขึ้น
- ตัวอย่าง: 1440 แท่งบน M1 = ข้อมูล 24 ชั่วโมง
Analysis Horizon (bars)
"ฉันควรดูราคานานแค่ไหนก่อนเริ่มใหม่?"
- ระยะเวลาที่แต่ละช่วงการวิเคราะห์ดำเนินอยู่ก่อนที่ช่วงจะรีเซ็ต
- กำหนดกรอบเวลาที่คุณกำลังวิเคราะห์ - สั้น = รีเซ็ตบ่อย, ยาว = ช่วงคงที่นานขึ้น
- ตัวอย่าง: 60 แท่ง = ช่วงคงอยู่ 60 แท่ง แล้วคำนวณใหม่จากราคามาตรฐานใหม่
ความน่าจะเป็นของความเสี่ยง
"ฉันต้องการความมั่นใจแค่ไหนว่าราคาจะไม่ถึงระดับเหล่านี้ตามปกติ?"
- กำหนดระดับความเชื่อมั่นสำหรับช่วง (เหมือนขอบเขตความปลอดภัย)
- ค่าสูง = ช่วงกว้างขึ้น (สัญญาณน้อยลง), ค่าต่ำ = ช่วงแคบลง (สัญญาณมากขึ้น)
- ตัวอย่าง: 0.80 = ความมั่นใจ 80% ว่าราคาจะอยู่ในช่วงภายใต้สภาวะปกติ
Decay Factor (λ - Lambda)
"ฉันควรให้ความสำคัญกับสิ่งที่เพิ่งเกิดขึ้นมากกว่าหรือปฏิบัติต่อประวัติทั้งหมดอย่างเท่าเทียมกัน?"
- ควบคุมว่าควรให้น้ำหนักกับข้อมูลล่าสุดมากแค่ไหนเทียบกับข้อมูลเก่าในการคำนวณความผันผวน
- ค่าสูง = ข้อมูลล่าสุดมีความสำคัญมากขึ้น; ค่าต่ำ = ข้อมูลทั้งหมดมีน้ำหนักเท่าเทียมกันมากขึ้น
- ตัวอย่าง 0.95 = ความผันผวนล่าสุดมีอิทธิพลอย่างมากต่อการคำนวณ
จุดสำคัญที่ควรจำ
นี่คือเครื่องมือการจัดการความเสี่ยง – ระบุเหตุการณ์ความผันผวนและความมั่นคงในช่วงเวลาต่างๆ
ช่วงความเชื่อมั่นเป็นสิ่งสำคัญ – ช่วงต้องไม่ตามราคาคล้าย ATR – ช่วงถูกคำนวณสำหรับแต่ละช่วงการวิเคราะห์
การเข้าซื้อใหม่ต้องใช้ความอดทน – อย่าคาดหวังการเข้าซื้อใหม่ทันทีหลังออก – ตลาดต้องการเวลาปรับตัว
พารามิเตอร์เฉพาะสินทรัพย์และกรอบเวลา – พารามิเตอร์เริ่มต้นเป็นจุดเริ่มต้น – ปรับแต่งให้เหมาะกับตลาดและสไตล์ของคุณ – สิ่งที่ใช้ได้ผลใน FX อาจไม่เหมาะกับดัชนี โลหะ หรือคริปโต
( * ) ตัวชี้วัดนี้จัดทำขึ้นเพื่อวัตถุประสงค์ทางการศึกษาและข้อมูลเท่านั้น ไม่ได้มีเจตนาเป็นคำแนะนำทางการเงินหรือการลงทุน สิ่งใดในผลิตภัณฑ์นี้ เอกสารประกอบ หรือวัสดุที่เกี่ยวข้องไม่ควรถูกตีความว่าเป็นคำแนะนำให้ซื้อ ขาย หรือถือครองเครื่องมือทางการเงิน การซื้อขายในตลาดการเงินมีความเสี่ยงสูงและอาจไม่เหมาะสมสำหรับนักลงทุนทุกคน ผลการดำเนินงานในอดีตไม่ใช่ตัวบ่งชี้ผลลัพธ์ในอนาคต ไม่มีการรับประกันผลกำไร และผู้ใช้สามารถขาดทุนอย่างมากได้ โดยการใช้ตัวชี้วัดนี้ คุณยอมรับว่าคุณเป็นผู้รับผิดชอบแต่เพียงผู้เดียวต่อการตัดสินใจซื้อขายและผลลัพธ์ทางการเงินของคุณ ผู้สร้างผลิตภัณฑ์นี้จะไม่รับผิดชอบต่อความสูญเสียหรือความเสียหายใดๆ ที่เกิดขึ้นโดยตรงหรือโดยอ้อมจากการใช้งาน โปรดทำการวิเคราะห์ของคุณเองก่อนตัดสินใจซื้อขายใดๆ
สรุป
Key features include Value at Risk (VaR) estimates to anticipate potential losses, robustness against strong short-term trends, and analysis of post-jump corrections to identify safe re-entry timings. Core adjustable parameters allow users to tailor the indicator to specific assets and timeframes, including lookback period for volatility calculation, analysis horizon for band recalculation frequency, risk probability to set confidence levels, and decay factor to weight recent versus older data.
The indicator emphasizes patience for re-entry after exits, as market stabilization is required. It is intended as a tool for identifying volatility events and managing risk rather than providing direct trade signals. Users should optimize parameters according to their trading style and market conditions.
รีวิวจากลูกค้า
5 | 100 % | |
4 | 0 % | |
3 | 0 % | |
2 | 0 % | |
1 | 0 % |


