
Descrição
Visualizador Institucional de Suporte e Resistência
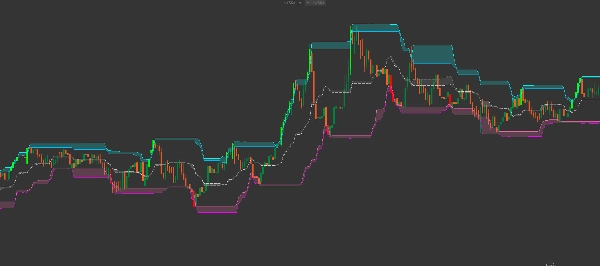
O Smart Donchian Cloud Reversal é um canal de volatilidade de próxima geração projetado para identificar zonas de reversão de alta probabilidade. Ao contrário dos Canais Donchian padrão que apenas acompanham as máximas mais altas e as mínimas mais baixas, este indicador analisa a relação entre pavios das velas e corpos das velas para traçar "Nuvens de Pressão."
Essas nuvens atuam como zonas dinâmicas de Oferta e Demanda, mostrando exatamente onde o mercado provavelmente vai estagnar ou reverter.
Arquitetura Avançada Multi-Nuvem
Este indicador apresenta um sistema sofisticado de nuvens em 3 camadas:
-
- A Nuvem de Resistência (Ciano/Azul): Localizada no topo, visualiza a lacuna entre o pavio mais alto e o corpo da vela mais alto. Esta é a "Zona de Venda."
- A Nuvem de Equilíbrio (Cinza/Prata): Uma faixa central que acompanha o equilíbrio do mercado. Representa o ponto médio de valor justo entre pavios e corpos.
- A Nuvem de Suporte (Rosa/Magenta): Localizada na parte inferior, visualiza a lacuna entre o pavio mais baixo e o corpo da vela mais baixo. Esta é a "Zona de Compra."
Principais Características de Negociação
-
- Filtro de Volatilidade ATR: Inclui um multiplicador ATR (Average True Range) embutido para deslocar ligeiramente as bandas externas, filtrando o ruído do mercado e "caça a stops."
- Pintura Inteligente de Velas: O indicador destaca automaticamente o momentum de rompimento:
- Velas LIMA: O preço fechou acima da Nuvem de Resistência Superior (Rompimento de Alta).
- Velas VERMELHAS: O preço fechou abaixo da Nuvem de Suporte Inferior (Rompimento de Baixa).
- Lógica Pavio vs. Corpo: Ao observar a "espessura" da nuvem, você pode avaliar a volatilidade. Uma nuvem espessa significa pavios longos (alta rejeição/indecisão), enquanto uma nuvem fina significa ação de preço forte e decisiva.
Como Negociar com as Nuvens Donchian Inteligentes
1. A Reversão à Média (Scalping) » Procure o preço entrar na Nuvem de Resistência sem fechar acima dela. Isso frequentemente indica um "falso rompimento", sinalizando uma entrada curta de alta probabilidade de volta para a Linha Média.
2. O Rompimento de Tendência » Quando uma vela fica Lima (fechando acima do filtro do pavio superior), isso sinaliza que os touros ultrapassaram a zona de resistência. Este é um sinal poderoso para estratégias de seguimento de tendência.
3. O Rebate no Suporte »Observe a Nuvem de Suporte (Rosa). Quando o preço toca essa zona durante um recuo em uma tendência de alta, representa uma área de "Compra de Valor" onde compradores institucionais frequentemente entram.
Parâmetros Técnicos
-
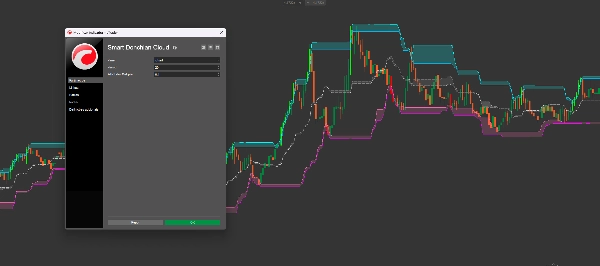
- Período: O período de retrocesso para calcular máximas e mínimas (Padrão: 20).
- Multiplicador do Filtro ATR: Ajusta o "acolchoamento" ao redor dos extremos para evitar ser pego em picos menores.
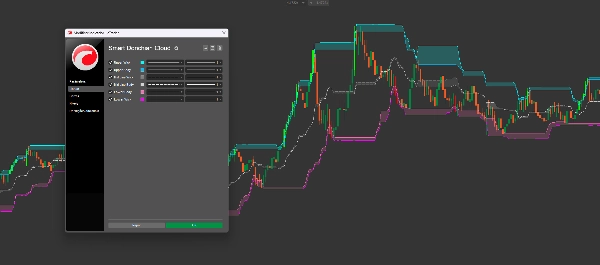
- Cores Totalmente Personalizáveis: Personalize as nuvens Superior, Média e Inferior para se adequar ao seu modelo de gráfico pessoal.
Por Que Esta Ferramenta é Essencial
A maioria dos traders falha porque trata Suporte e Resistência como linhas únicas. Na realidade, eles são Zonas. O Smart Donchian Cloud Reversal mapeia essas zonas matematicamente, dando a você uma imagem mais clara da estrutura do mercado do que qualquer indicador tradicional de canal.
Resumo
Avaliações de clientes
5 | 100 % | |
4 | 0 % | |
3 | 0 % | |
2 | 0 % | |
1 | 0 % |


