
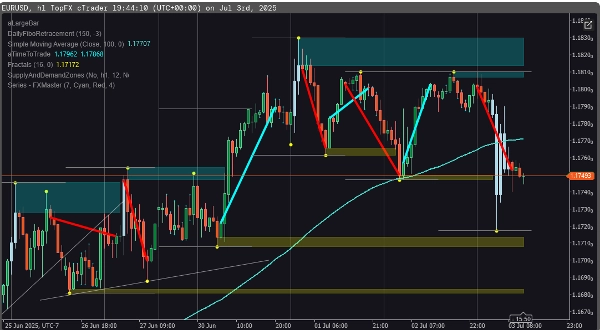
Series - FXMaster
Indicador
3 compras
Versão 1.0, Jul 2025
Windows, Mac
4.6
Avaliações: 3

Descrição
Descubra tendências de alta probabilidade com precisão. O Multi-Symbol Trendlines indicador detecta séries de Máximas Mais Altas / Mínimas Mais Altas / Fechamentos Altos ou Mínimas Mais Baixas / Máximas Mais Baixas / Fechamentos Baixos, oferecendo insights claros e personalizáveis sobre tendências de alta e baixa—em qualquer símbolo de mercado.
🚀 Principais Recursos
- Detecção de Sequência de Tendência: Identifique sequências de alta ou baixa com base em padrões consecutivos da estrutura de preços.
- Limiares Personalizáveis: Defina quantas barras são necessárias para confirmar uma tendência válida—ajuste para combinar com sua estratégia.
- Linhas de Tendência Visuais: Desenha automaticamente linhas de tendência diretamente no seu gráfico—coloridas para tendências de alta e baixa.
🎯 Para Quem É
- Traders de Ação de Preço que dependem da estrutura e do ritmo mais do que de indicadores.
- Seguidores de Tendência buscando confirmação antecipada da estrutura.
- Observadores Multi-Símbolos que precisam de uma ferramenta para governar todas.
Resumo
Resumo de IA
The Series - FXMaster indicator identifies high-probability trends by detecting sequences of price action patterns such as Higher Highs, Higher Lows, High Closes, Lower Lows, Lower Highs, and Low Closes. It provides clear, customizable insights into uptrends and downtrends across any market symbol, including Forex, indices, commodities, cryptocurrencies, and stocks. Key features include trend sequence detection to spot bullish or bearish patterns based on consecutive price structures, customizable thresholds allowing users to set the number of bars required to confirm a trend, and automatic drawing of color-coded trendlines directly on charts for visual clarity. This tool is designed for price action traders who prioritize market structure and rhythm, trend followers seeking early confirmation of trends, and multi-symbol watchers who require a unified indicator for multiple markets.
Perfil do indicador
Avaliações de clientes
4.6
Avaliações: 3
5 | 67 % | |
4 | 33 % | |
3 | 0 % | |
2 | 0 % | |
1 | 0 % |
Avaliações de clientes
July 14, 2025
The opening read should not drive the whole decision, but it is just a support layer.
July 8, 2025
The journal has a cleaner path, but it works better with a written plan.
Conversa
Perguntas frequentes
Forex
Indices
Commodities
Crypto
Stocks
Os produtos disponíveis através da cTrader Store, incluindo bots de negociação, indicadores e plugins, são fornecidos por programadores terceiros e são disponibilizados apenas para fins informativos e de acesso técnico. A cTrader Store não é um corretor e não fornece aconselhamento em matéria de investimento, recomendações pessoais ou qualquer garantia de desempenho no futuro.


![Logótipo de "[Stellar Strategies] MARSI Signal Plotter"](https://cdn.ctrader.com/image/webp/7b2b8da6-8f8e-4646-8d4a-4710c516c01e_25567)
Preço
Desde 11/01/2025
19
Vendas