
説明
Woodie_CCI_pro は、クラシックな Woodie CCI メソッドを中心に構築された高度なCCIベースのツールキットです。
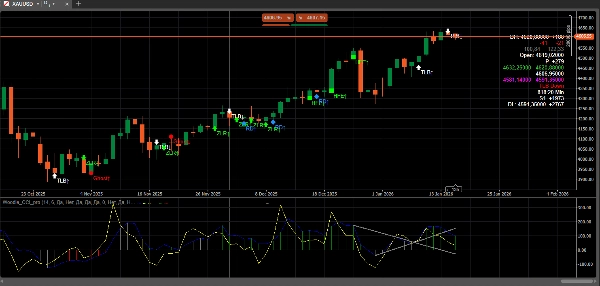
スムージングを施したWoodieスタイルのCCIをプロットし、最も重要なWoodieパターンを 明確なチャート上のシグナル、オプションのオシレーター・マーカー、およびCCIペイン内のオプションの TLBトレンドラインガイダンス で強調表示し、より良いコンテキストと迅速な意思決定を可能にします。
設計目的は 過去の視認性の明確さ です:すべてのシグナルは履歴上に描画され、ラベルは正確なパターン名を表示し、トレンドラインの描画はスケールの歪みや「ラインアーティファクト」を避けるよう最適化されています。
コア機能
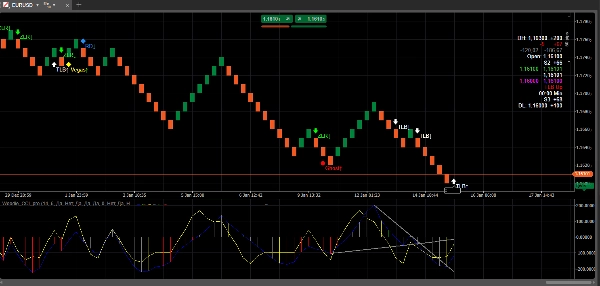
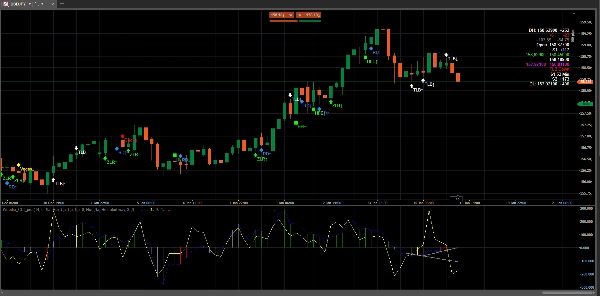
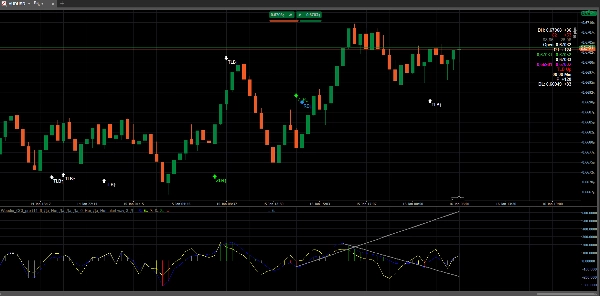
1) Woodieパターン検出(自動シグナル)
Woodie_CCI_proは以下のWoodieパターンを検出しラベル付けします:
- ZLR (ゼロラインリジェクト)
- ゴースト
- HFE (エクストリームからのフック)
- TLB (トレンドラインブレイク)
- HTLB (水平トレンドラインブレイク)
- RD (リバースダイバージェンス)
- ファミール
- ベガストレード (VT)
各シグナルは方向を示すマーカー(上昇/下降)とラベル(例: ZLR↑、TLB↓)で描画され、何が発動したかを 正確に 知ることができます。
2) 価格チャート上の直接シグナル
シグナルは 価格チャート 上に矢印やアイコン、テキストラベルで表示され、履歴やライブセットアップの確認時に最大限の明瞭さを提供します。
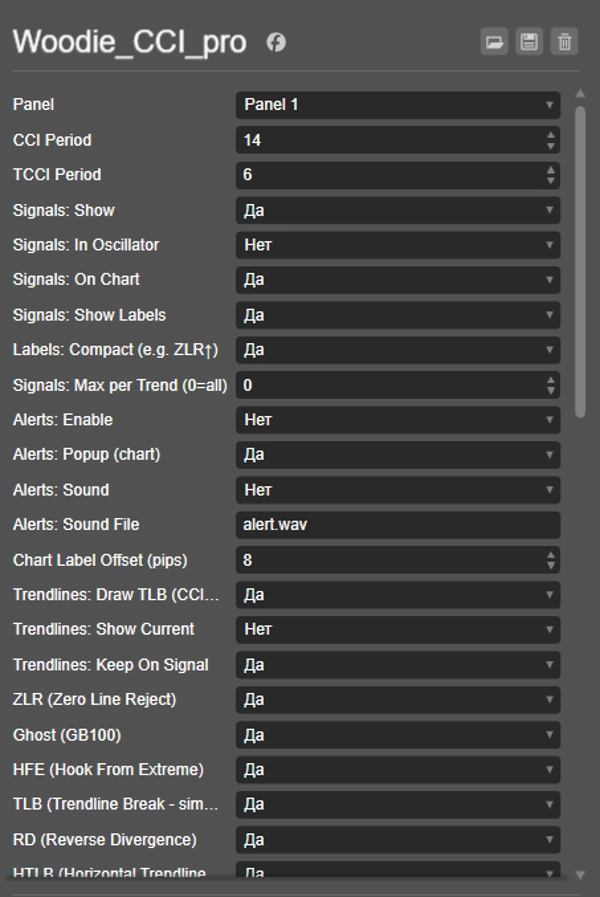
オプションには以下が含まれます:
- チャート上のシグナルの表示/非表示
- ラベルの表示/非表示
- コンパクトラベル形式(例:
RD↑) - ラベル/マーカーのピップ単位のオフセットによるきれいな配置
3) オプションのオシレーター・マーカー
クラシックなWoodieの感覚を好む場合は、CCIペイン内の シグナルマーカー(ポイント/ドット) をオプションで有効にできます。
これは完全にオプションであり、チャートレベルのシグナルのみを望む場合はオシレーターをクリーンに保てます。
4) CCIペイン内のTLBトレンドラインガイダンス(スケール問題なし)
構造認識を向上させるため、インジケーターは CCIペイン内にTLBトレンドライン を描画できます:
- 現在のTLBライン(最新のスイング間ガイダンス)
- Keep On Signal オプションは、ブレイクアウト時に使用されたトレンドラインを後で確認できるよう保持します
描画は履歴上でクリーンに保ち、「エッジ」アーティファクトや強制スケーリングを避けるよう設計されています。
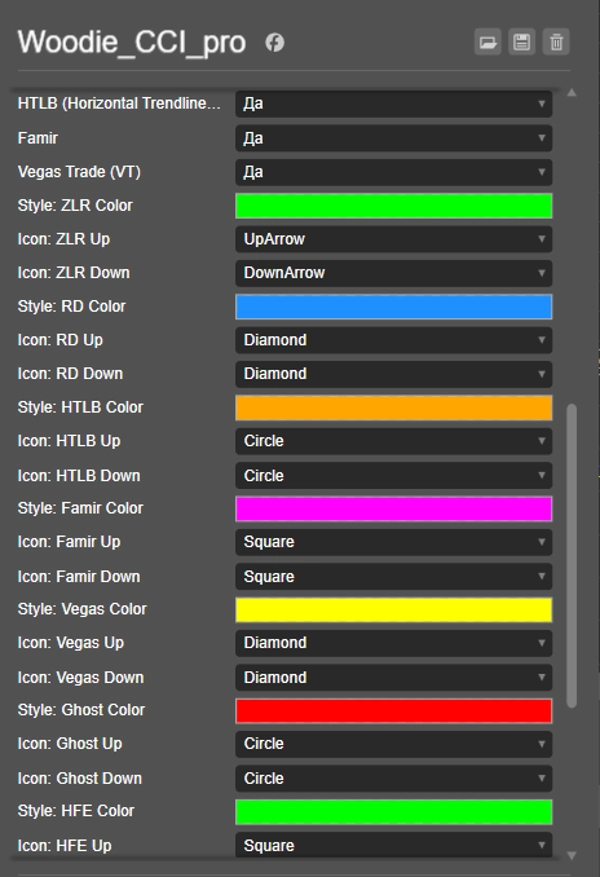
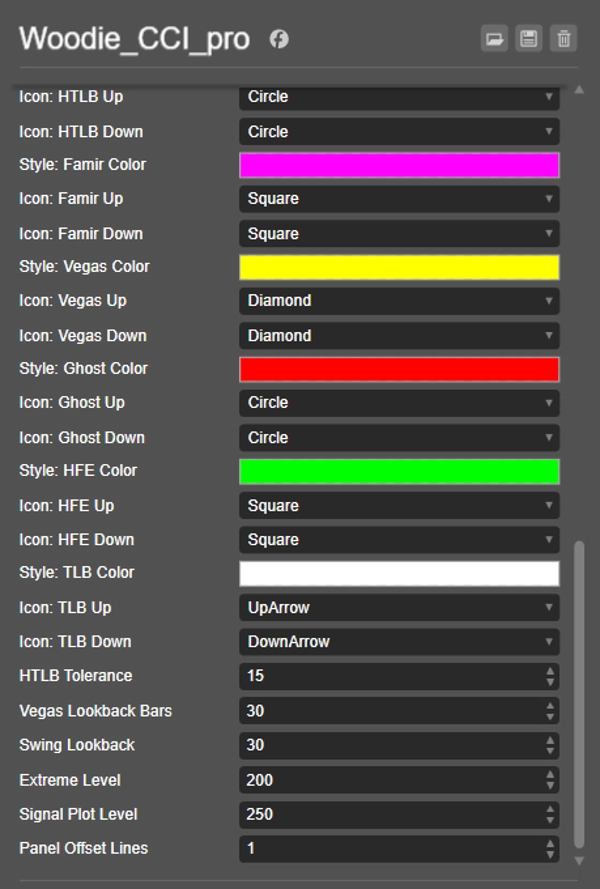
5) スタイル&ビジュアライゼーションコントロール(パターンごと)
パターンごとに視覚的な外観をカスタマイズできます:
- 上昇/下降用のアイコンタイプ
- パターンごとの色(対応している場合)
- コンパクトラベルとフルラベルの選択
6) アラート(オプション)
選択したシグナルのアラートを有効にできます:
- チャート上のポップアップスタイルメッセージ
- オプションのサウンド通知(プラットフォーム設定が対応している場合)
7) 「トレンドごとの最大シグナル」フィルター(オプション)
ノイズを減らすために、トレンドごとのシグナル数を制限できます:
トレンドごとの最大数(0 = 無制限)- 現在のトレンド(TCCIの符号に基づく)に沿ったシグナルのみをカウント
典型的なワークフロー
- チャートに Woodie_CCI_pro を追加します。
- 履歴上のパターン挙動を素早く学習するために、チャート上のシグナル と ラベル を有効にします。
- ブレイクや継続トレードの構造的コンテキストが欲しい場合は TLBトレンドライン をオンにします。
- クラシックなWoodieドット確認を好む場合は、オプションで オシレーター・マーカー を有効にします。
注意事項と哲学
- このインジケーターは「過剰適合」よりも 実用的で読みやすい ことを目指しています。
- 一部のパターン(特にTLB/HTLB/RD/ベガスのようなラインベースのもの)は、市場構造が銘柄や時間軸によって異なるため、調整可能な許容範囲や遡及期間を含みます。
- 視覚出力は クリーンな履歴、安定したスケーリング、最小限の乱雑さに最適化されています。
概要
カスタマーレビュー
5 | 50 % | |
4 | 50 % | |
3 | 0 % | |
2 | 0 % | |
1 | 0 % |


