

Descrizione
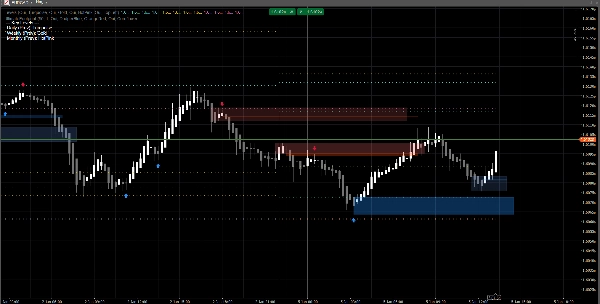
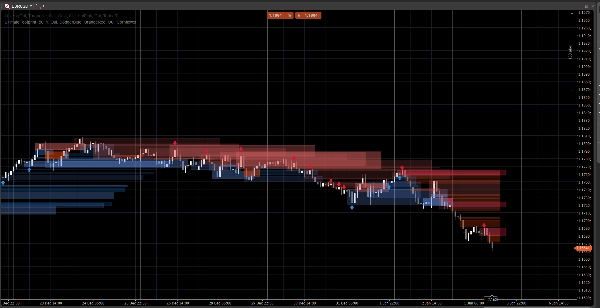
Un sistema di struttura di mercato pulito che mostra gap di prezzo, blocchi d'ordine e segnali basati su breakout, con conferma del volume opzionale e avvisi di retest. Progettato per chiarezza sia su grafici standard che Renko.
Questo indicatore si concentra su leggibilità ed esecuzione, non sull'ingombro. Le zone sono estese in avanti e gestite automaticamente (scadenza / invalidazione), aiutandoti a monitorare i livelli importanti mentre il prezzo si sviluppa.
Cosa rileva
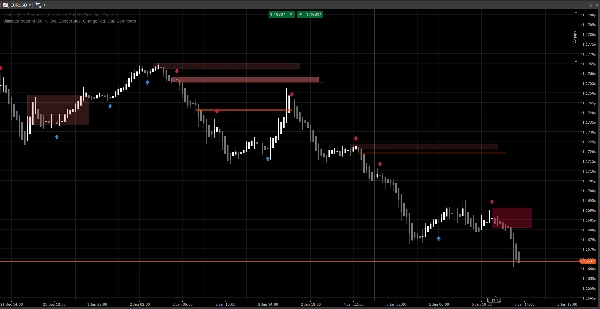
Gap di Prezzo (inefficienze a 3 barre)
- Evidenzia gap rialzisti e ribassisti direttamente sul grafico
- Visualizzazione opzionale (attiva/disattiva)
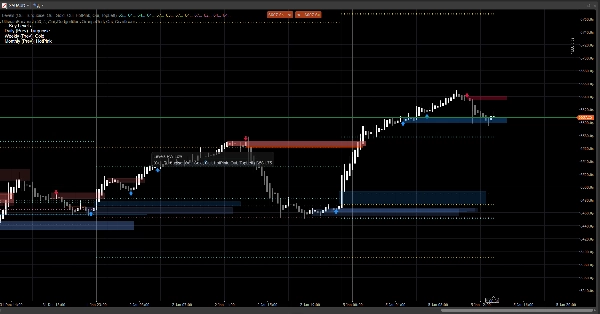
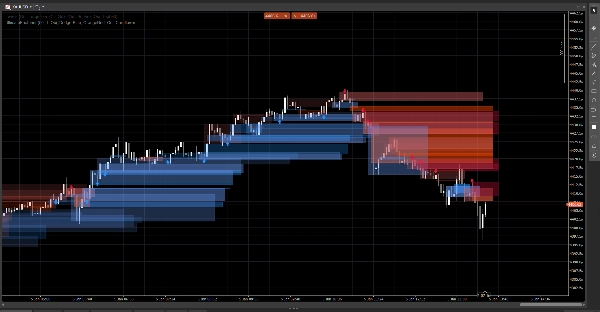
Blocchi d'Ordine (ultima candela opposta prima dello spostamento)
- Zone OB rialziste e ribassiste
- Estensione automatica in avanti fino a invalidazione / raggiungimento estensione massima
Segnali di Rottura della Struttura (logica di breakout swing)
- Rilevamento basato su breakout usando massimi/minimi swing
- Stampa frecce segnale (su/giù) quando un nuovo blocco d'ordine è confermato
Aggiornamenti in tempo reale
- Progettato per aggiornarsi fluidamente in condizioni live
- Funziona su candele classiche e si comporta bene su azione di prezzo in stile Renko
Filtraggio intelligente (opzionale)
Conferma del volume
- Puoi richiedere una conferma Z-score del volume prima di convalidare un segnale di blocco d'ordine
- Linea base e sensibilità regolabili
Avvisi (opzionali)
Abilita avvisi per:
- Nuovo blocco d'ordine rilevato
- Retest del blocco d'ordine con direzione (candela di rifiuto)
Come usarlo (flusso di lavoro semplice)
- Usa Gap di Prezzo e Blocchi d'Ordine come zone di reazione (aree di interesse).
- Lascia che Segnali evidenzino le rotture di struttura e la corrispondente formazione OB.
- Usa Avvisi di Retest per catturare i ritorni nella zona con comportamento di rifiuto.
- Combina con i tuoi ingressi/uscite (la gestione del rischio resta tua).
Panoramica degli input
Logica del Volume
- Linea Base del Volume: periodo di smoothing usato per il calcolo dello Z-score
- Sensibilità del Volume: controlla quanto il volume influisce sulla visibilità della zona
Gap di Prezzo
- Mostra Gap di Prezzo
- Colori Gap Rialzisti / Ribassisti
Blocchi d'Ordine
- Mostra OB
- Colori OB Rialzisti / Ribassisti
- Estensione Massima: quanto le zone si estendono in avanti
Segnali
- Mostra Frecce
- Lookback Swing: definisce la finestra di rilevamento swing
- Richiedi Conferma del Volume (opzionale)
- Soglia del Volume + Periodo del Volume
- Colori Segnale
- Trasparenza della Zona
- Barre di Estensione Massima (segnali)
Avvisi
- Abilita Avvisi
- Avviso Nuovo OB
- Avviso Retest
FAQ
1) Si ripittura?
No.
L'indicatore non “sposta” i segnali storici in nuove posizioni dopo che la barra è chiusa.
- Le zone (gap / rettangoli OB) sono create da barre storiche e poi estese in avanti.
- I segnali (frecce) sono confermati da condizioni di barra chiusa (rottura swing + selezione OB).
Una volta che una freccia è stampata, non viene spostata retroattivamente.
Sfondo importante (comportamento normale):
Mentre la barra corrente si sta ancora formando, i prezzi (Massimo/Minimo/Chiusura) possono ancora cambiare. Questo può causare:
- una zona che aggiorna la sua estensione sul bordo destro (estensione visiva),
- una condizione di retest che diventa temporaneamente vera poi falsa sulla stessa barra in formazione.
Questo non è ripitturazione—è un aggiornamento in tempo reale su una candela non finita.
2) Qual è la differenza tra “ridisegno” e “ripitturazione” qui?
Ridisegno = sì (per progettazione).
Ripitturazione = no.
- Ridisegno significa che i rettangoli vengono ridisegnati/estesi sul grafico così la zona continua a proiettarsi nel futuro. Questo è necessario per una sovrapposizione in stile “impronta” live.
- Ripitturazione significherebbe che l'indicatore cambia i segnali confermati passati (frecce/zone) dopo il fatto. Questo non accade.
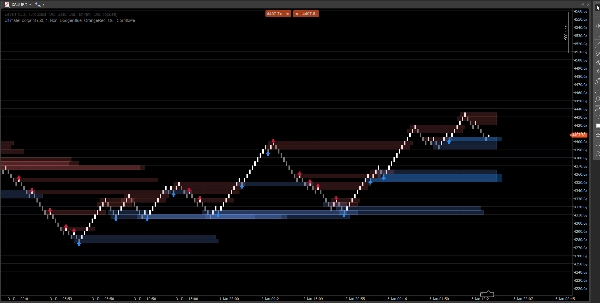
3) Perché a volte le zone cambiano forma o opacità?
Perché le zone sono ponderate per volume usando un modello Z-score:
SMA(volume)+StdDev(volume)sul tuo periodo base- l'opacità/alpha scala con la deviazione del volume
Quindi se cambi:
- Linea Base del Volume
- Sensibilità del Volume
- o il feed del simbolo è diverso
L'intensità visiva può variare. La posizione della zona resta basata sul prezzo; la visibilità può riflettere il contesto del volume.
4) Perché a volte alcuni avvisi “mancano” o sono “disattivati”?
Ci sono 3 motivi tecnici, e sono tutti intenzionali:
A) Gli avvisi richiedono una condizione di congiunzione rigorosa
Per un avviso di retest, l'indicatore richiede:
- il prezzo si sovrappone alla zona OB, E
- una condizione di candela di rifiuto è soddisfatta (esempio: rifiuto rialzista richiede
Chiusura > Apertura)
Se il prezzo tocca la zona ma chiude neutro / opposto, non viene attivato alcun avviso di retest.
B) Logica di avviso una tantum (anti-spam)
Ogni OB ha un flag interno (es: Alerted) così non ricevi avvisi ripetuti ad ogni tick.
Quindi se il primo tocco non ha soddisfatto la regola di rifiuto, e successivamente la soddisfa ma il flag era già impostato (a seconda della tua versione), può sembrare “disattivato”.
C) Comportamento del tipo di grafico (Renko / aggregazione tick)
Su Renko, il “mattone corrente” non è una candela classica. Durante la formazione:
- Apertura/Chiusura possono essere instabili o uguali
- la logica di retest può avvenire intrabar ma non confermare alla chiusura
Nel trading live, per massima affidabilità:
- Gli avvisi di nuovo OB sono solitamente puliti
- Gli avvisi di retest sono meglio trattati come avvisi di “rifiuto confermato” (non solo un tocco di stoppino)
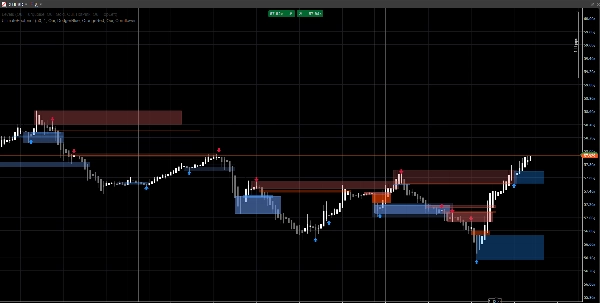
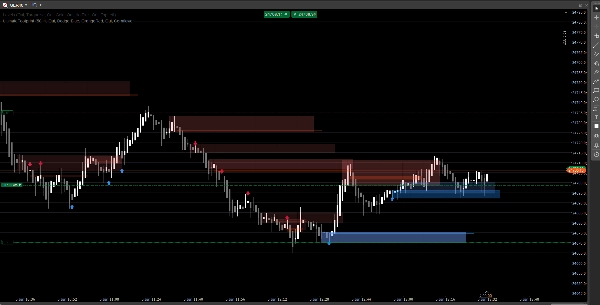
5) Nello screenshot: perché alcuni OB non mostrano una freccia (o perché la freccia non corrisponde a ogni OB)?
Perché zone e frecce non sono lo stesso motore:
- Le zone (rettangoli OB) possono essere visualizzate dalla logica di rilevamento zona (OB derivati da gap / zone di azione del prezzo).
- Le frecce sono stampate solo quando viene rilevato un evento di struttura:
-
- un massimo/minimo swing viene rotto (Break of Structure),
- poi l'algoritmo cerca all'indietro per trovare l'ultima candela opposta = l'OB valido.
Quindi potresti vedere una zona OB senza freccia se:
- non c'è stata una rottura swing convalidata,
- il candidato OB non ha superato il filtro del volume (se abilitato),
- o è una zona creata dal motore gap ma non confermata dal motore struttura.
Ecco esattamente perché lo strumento è utile:
Le zone ti danno la mappa. Le frecce evidenziano i momenti di massima congiunzione.
6) Posso forzare gli OB a corrispondere sempre alle frecce?
Sì, tecnicamente puoi eseguirlo in modalità “solo segnali” disabilitando il livello di zona che non vuoi:
- Disattiva Gap di Prezzo se vuoi solo zone guidate dalla struttura
- Disattiva Mostra OB (zone) se vuoi solo OB confermati da frecce
7) Funziona su tutti i timeframe e simboli?
Sì, ma i risultati dipendono da:
- volatilità,
- liquidità,
- qualità del volume tick,
- e la sessione di mercato.
Crypto e indici si comportano diversamente dal FX.
Note e Disclaimer
Questo indicatore è uno strumento visivo di supporto decisionale, non un servizio di segnali e non un consiglio finanziario.
Tutti i mercati e i timeframe si comportano in modo diverso — convalida sempre sui tuoi dati e gestisci il rischio in modo appropriato. Il comportamento passato non garantisce risultati futuri.
Riepilogo
Recensioni dei clienti
5 | 100 % | |
4 | 0 % | |
3 | 0 % | |
2 | 0 % | |
1 | 0 % |


