
Levels
Indikator
175 muat turun
Versi 1.0, Jan 2026
Windows, Mac
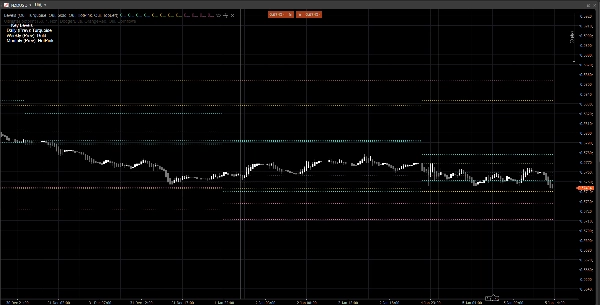
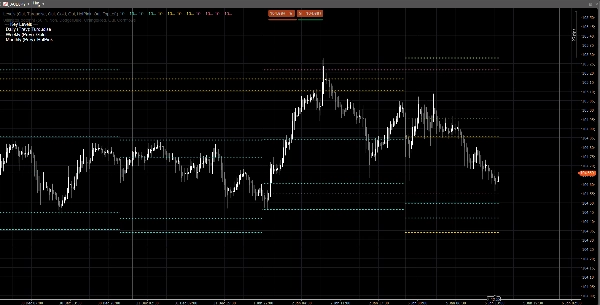
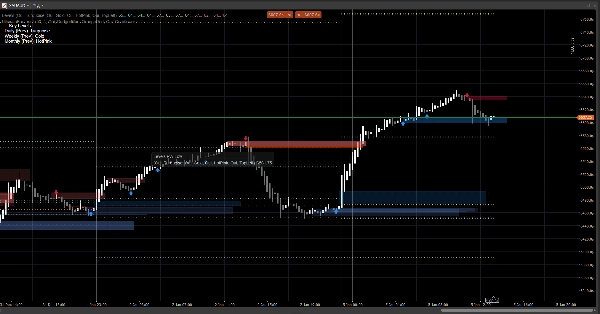
Zon Tindakan Harga adalah penunjuk ringan tanpa gangguan yang memplot tahap utama Harian, Mingguan, dan Bulanan sebelumnya terus pada carta anda.
Ia memaparkan:
- Hari Sebelumnya: Tinggi / Rendah / Buka / Tutup
- Minggu Sebelumnya: Tinggi / Rendah / Buka / Tutup
- Bulan Sebelumnya: Tinggi / Rendah / Buka / Tutup
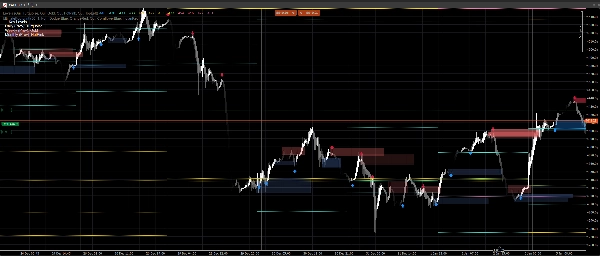
Tahap-tahap ini digunakan secara meluas sebagai zon reaksi, rujukan kecairan, dan jangkar konteks untuk struktur pasaran, kemasukan, sasaran, dan penempatan risiko.
Mengapa ia berguna
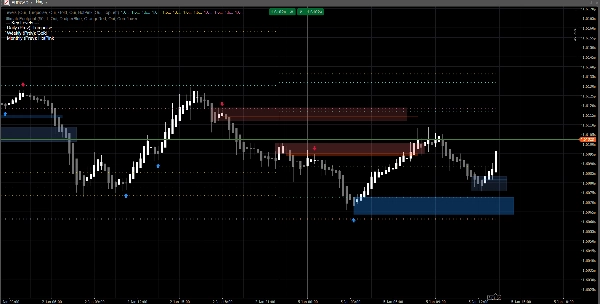
- Lihat dengan segera tahap rujukan jangka masa lebih tinggi tanpa menukar carta
- Membantu anda membingkai tindakan harga intrahari sekitar PDH/PDL, PWH/PWL, PMH/PML
- Visual yang bersih: tahap kekal tetap untuk sesi/minggu/bulan semasa
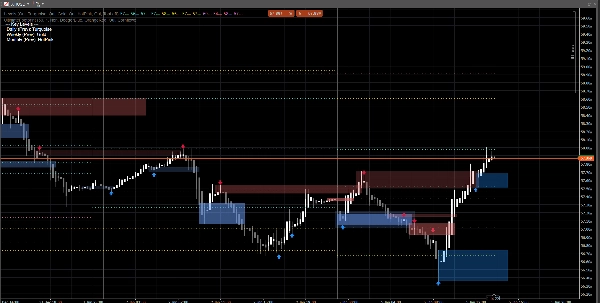
- Berfungsi pada mana-mana simbol dan jangka masa
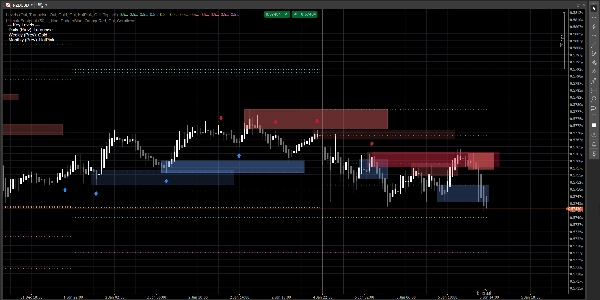
Penyesuaian
Anda boleh menghidupkan atau mematikan setiap jangka masa secara bebas:
- Tunjukkan Harian / Mingguan / Bulanan
- Tetapkan warna tersuai untuk setiap kumpulan
- Aktifkan legenda mudah, dengan penempatan sudut yang boleh dipilih
Nota teknikal
- Tahap dikira menggunakan lilin Harian/Mingguan/Bulanan selesai sebelumnya (bukan yang sedang terbentuk sekarang).
- Ini mengelakkan pengubahsuaian semula dan mengekalkan tahap stabil sepanjang sesi.
Penafian
Penunjuk ini disediakan untuk tujuan carta dan sokongan keputusan sahaja. Ia tidak menjana isyarat beli/jual dan bukan nasihat kewangan. Sentiasa urus risiko dan sahkan dengan data anda sendiri.
Isyarat pada carta dijana oleh penunjuk Ultimate Footprint yang tersedia di profil saya.
Profil indikator
0.0
Ulasan: 0
Ulasan pelanggan
Belum ada ulasan untuk produk ini. Anda sudah mencuba produk tersebut? Jadilah yang pertama untuk berkongsi pendapat anda!
Prop
Forex
Indices
Commodities
Crypto
Stocks
Produk yang tersedia melalui cTrader Store, termasuk bot dagangan, indikator dan plugin, disediakan oleh pembangun pihak ketiga dan diberikan akses untuk tujuan maklumat dan teknikal sahaja. cTrader Store bukan broker dan tidak memberikan nasihat pelaburan, syor peribadi atau sebarang jaminan prestasi masa hadapan.


Sejak 23/07/2025
6.91M
Volum yang didagangkan
27.63K
Pip dimenangi
877
Pemasangan percuma