
설명
돌파 채널
기능
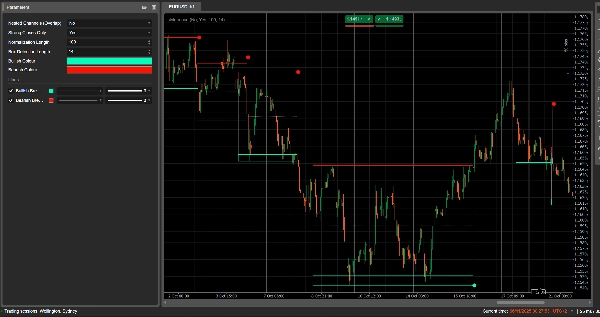
돌파 채널은 자동으로 횡보 구간(가격 “박스”)을 감지하고 가격이 해당 구간을 벗어날 때 돌파 지점을 표시합니다.
다음과 같이 그립니다:
- 횡보 구간 주변의 회색 채널 박스
- 잠재적 저항인 빨간색 상단 밴드
- 잠재적 지지인 녹색 하단 밴드
- 채널 중간점인 흰색 점선 중간선
- 돌파 발생 시 색깔 점을 표시합니다:
-
- 박스 아래의 녹색/청록색 점 → 강세 돌파
- 박스 위의 빨간 점 → 약세 돌파
이 아이디어는 가격이 횡보하는 구간과 구간이 깨질 때 강한 움직임이 시작될 가능성이 높은 영역을 시각적으로 강조하는 것입니다.
계산 방법
- 가격 정규화
-
- 최근 정규화 길이 기간 동안 최고가와 최저가를 찾습니다.
- 종가를 0–1 범위로 정규화합니다:
normalizedPrice=Close−LowestLowHighestHigh−LowestLow\text{normalizedPrice} = \frac{\text{Close} - \text{LowestLow}}{\text{HighestHigh} - \text{LowestLow}}normalizedPrice=HighestHigh−LowestLowClose−LowestLow
- 변동성 측정
-
- 14 기간 동안 정규화된 가격의 표준 편차를 계산합니다.
- 이 값은 시장 구조의 전환점을 감지하는 데 사용되는 변동성 시리즈를 제공합니다.
- 상단 / 하단 “변동성 선”
-
- 최근 (박스 감지 길이 + 1) 기간 동안 다음을 찾습니다:
-
- 변동성이 가장 높았던 기간
- 변동성이 가장 낮았던 기간
- 이 극값들이 발생한 기간을 바탕으로 두 개의 합성 선인 상단과 하단을 만듭니다.
- 이 선들의 교차는 채널 단계의 시작/종료 가능성을 알립니다.
- 채널 시작 및 기간
-
- 하단이 상단을 넘을 때, 지표는 잠재적 채널 시작을 표시합니다.
- 그 시점부터 기간과 해당 기간 내 최고가/최저가를 추적합니다.
- 채널 생성
-
- 이후 상단이 다시 하단을 넘고, 기간이 10 이상이면:
-
- 해당 기간 내 최고가를 채널 상단으로 정의합니다.
- 최저가를 채널 하단으로 정의합니다.
- 현재 ATR/2를 측정하여 상단과 하단에 얇은 구간을 구분합니다:
-
- 빨간 밴드 (약세 밴드) 상단에 표시
- 녹색 밴드 (강세 밴드) 하단에 표시
- 다음과 같이 그립니다:
-
- 회색 외곽 사각형 (전체 채널)
- 빨간색 상단 외곽선
- 녹색 하단 외곽선
- 중앙을 가로지르는 흰색 점선 중간선
- 채널은 돌파 후에도 차트에 남아 역사적 구조로 유지됩니다 (삭제되지 않음).
- 돌파 감지
-
- 각 활성 채널에 대해 새 봉이 형성될 때마다 기준 가격을 계산합니다:
-
- 만약 강한 종가만 허용 = true이면, 캔들 몸통의 중간점을 사용합니다:
refPrice=(Open+Close)/2\text{refPrice} = (\text{Open} + \text{Close})/2refPrice=(Open+Close)/2
이 경우 몸통의 절반 이상이 박스 밖에 있어야 합니다. - 만약 강한 종가만 허용 = false이면, 단순히 종가를 사용합니다.
- 만약 강한 종가만 허용 = true이면, 캔들 몸통의 중간점을 사용합니다:
- 돌파 규칙:
-
- 만약
refPrice > Top이면 → 강세 돌파 -
- 채널 하단에 녹색 점을 표시합니다.
- 이 채널을 비활성화하여 확장은 중지하지만 박스는 계속 표시됩니다.
- 만약
refPrice < Bottom이면 → 약세 돌파 -
- 채널 상단에 빨간 점을 표시합니다.
- 채널을 비활성화합니다.
- 그 외에는 채널이 여전히 활성 상태이며 오른쪽 가장자리가 현재 봉까지 확장됩니다.
- 만약
- 중첩 채널 옵션
-
- 만약 중첩 채널 = true이면, 여러 채널이 시간과 가격에서 겹칠 수 있습니다.
- 만약 false이면, 기존 채널과 겹치는 새 채널 생성을 차단합니다.
읽고 사용하는 방법
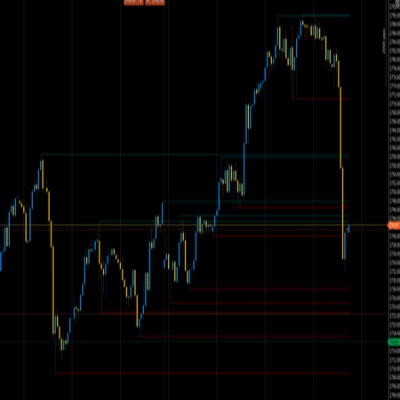
- 회색 박스 (채널)
-
- 가격이 일정 기간 거래된 횡보 / 균형 구간을 나타냅니다.
- 박스가 길고 높을수록 구간이 더 중요함을 의미합니다.
- 빨간 상단 밴드 (저항 구간)
-
- 채널 상단 부분으로, 잠재적 저항 영역으로 시각적으로 강조됩니다.
- 이 밴드 근처에서 반복적인 반등은 구간 내 매도 압력을 시사합니다.
- 녹색 하단 밴드 (지지 구간)
-
- 채널 하단 부분으로, 잠재적 지지로 강조됩니다.
- 반복적인 반등은 매수자가 구간 하단을 방어하고 있음을 나타냅니다.
- 흰색 점선 중간선
-
- 채널의 중간점 – 일종의 지역적 “공정 가치”입니다.
- 가격이 이 선을 중심으로 진동하면 균형 상태를 나타내며, 강한 움직임은 종종 반대 밴드 테스트 전에 발생합니다.
- 돌파 점
-
- 박스 아래의 녹색 점:
-
- 가격이 채널 상단 위에서 강하게 마감했거나 (또는 단순히 위에서 마감했거나, 강한 종가만 허용 설정에 따라 다름).
- 이는 강세 돌파를 시사하며, 변동성 수축에서 상승 움직임이 시작될 가능성이 있습니다.
- 박스 위의 빨간 점:
-
- 가격이 채널 하단 아래에서 강하게 마감했습니다.
- 이는 약세 돌파를 시사하며, 하락 움직임이 시작될 가능성이 있습니다.
- 일반적인 사용법 (아이디어 수준)
-
- 추세 추종 돌파
-
- 돌파 방향으로 거래합니다 (녹색 점 이후 매수, 빨간 점 이후 매도), 이상적으로는 상위 시간대 추세나 다른 지표와 일치할 때.
- 필터 및 확인
-
- 기존 전략에 대한 필터로서 채널과 돌파만 사용합니다 (예: 마지막 신호가 강세 돌파일 때만 롱 포지션 진입).
- 위험 설정
-
- 강세 돌파 시, 많은 트레이더가 이전 채널 내부 또는 바로 아래에 스톱을 설정하며, 약세 돌파 시에는 박스 내부 또는 위에 설정합니다.
요약
AI 요약
Breakout Channels is a technical indicator designed to identify consolidation zones and signal potential price breakouts. It automatically detects price ranges where the market is coiling, marking these with a grey channel box that highlights the consolidation area. The indicator draws a red upper band indicating potential resistance, a green lower band indicating potential support, and a white dotted midline representing the channel midpoint or local fair value.
Breakout points are signaled by colored dots: a green or cyan dot below the box indicates a bullish breakout, while a red dot above signals a bearish breakout. The indicator calculates these zones by normalizing price data, measuring volatility through the standard deviation of normalized prices, and identifying volatility extremes to define channel start and duration.
Channels remain visible on the chart as historical structures even after breakouts. Users can enable nested channels to allow overlapping consolidation zones. Breakout detection uses either candle body midpoints or close prices, depending on settings, to confirm strong closes outside the channel.
Typical uses include trading in the breakout direction, filtering existing strategies, and placing risk stops near channel boundaries. The indicator supports various markets including forex, indices, commodities, stocks, and cryptocurrencies.
지표 프로필
고객 리뷰
0.0
리뷰: 0
고객 리뷰
이 상품에 대한 리뷰가 아직 없습니다. 이미 사용해 보셨나요? 다른 사람들에게 가장 먼저 소개해 주세요!
상담
자주 묻는 질문(FAQ)
Signal
Indices
Commodities
GBPUSD
RSI
Bollinger
Fibonacci
Scalping
AI
XAUUSD
NAS100
MACD
BTCUSD
Forex
Breakout
EURUSD
NZDUSD
Martingale
Prop
ZigZag
Supertrend
Fair Value Gap
SMC
Crypto
Grid
Stocks
ATR
USDJPY
VWAP
트레이딩 봇, 지표, 플러그인 등 cTrader Store에서 제공되는 상품은 제3자 개발자에 의해 제공되며, 이는 단순히 정보 및 기술적 접근을 목적으로 제공된 것입니다. cTrader Store는 중개인이 아니며, 투자 조언, 개인별 추천 또는 향후 성과에 대한 어떠한 보장도 제공하지 않습니다.


가격
42.11M
거래량
6.13M
핍 수익
231
판매
8.56K
무료 설치