설명
개요
이 지표는 Alfred François Tagher가 2024년 2월 Technical Analysis of Stocks & Commodities 잡지에 발표한 "가격 및 시간 필터링에 의한 추세 식별" 방법론을 구현합니다.
이 개념은 가격 움직임과 시간 기반 필터링을 결합하여 시장 잡음을 줄이고 지속적인 추세를 식별합니다. 모든 가격 변동에 반응하는 대신, 이 지표는 가격이 이전 기간 범위를 벗어나 마감할 때만 추세 방향을 변경합니다. 이는 무작위 변동이 아닌 진정한 모멘텀을 신호합니다.
핵심 규칙
원래 규칙은 간단합니다:
- 기간의 종가가 이전 기간의 고가를 초과하면 → 추세는 상승
- 기간의 종가가 이전 기간의 저가 아래이면 → 추세는 하락
- 반전 조건이 발생할 때까지 추세는 변경되지 않습니다
이 접근법은 이전 기간 범위 내에 머무르는 작은 가격 변동을 필터링하여, 헌신을 보여주는 돌파에만 집중합니다.
작동 원리
이 지표는 현재 시간대의 종가를 선택한 상위 시간대의 이전 기간 고가 및 저가와 비교합니다:
- 추세 상승: 현재 종가 > 이전 기간 고가
- 추세 하락: 현재 종가 < 이전 기간 저가
- 변경 없음: 종가가 이전 기간 범위 내에 머무름
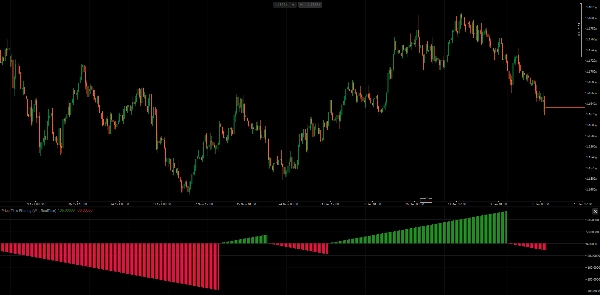
히스토그램은 현재 추세 방향의 바 수를 누적하여 표시합니다—상승 추세는 양수 값, 하락 추세는 음수 값으로 나타냅니다. 이는 추세 방향과 지속 기간을 시각화합니다.
필터링 모드
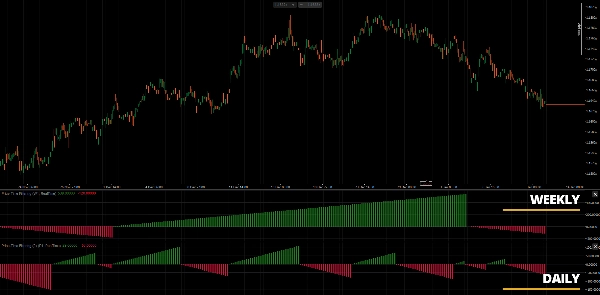
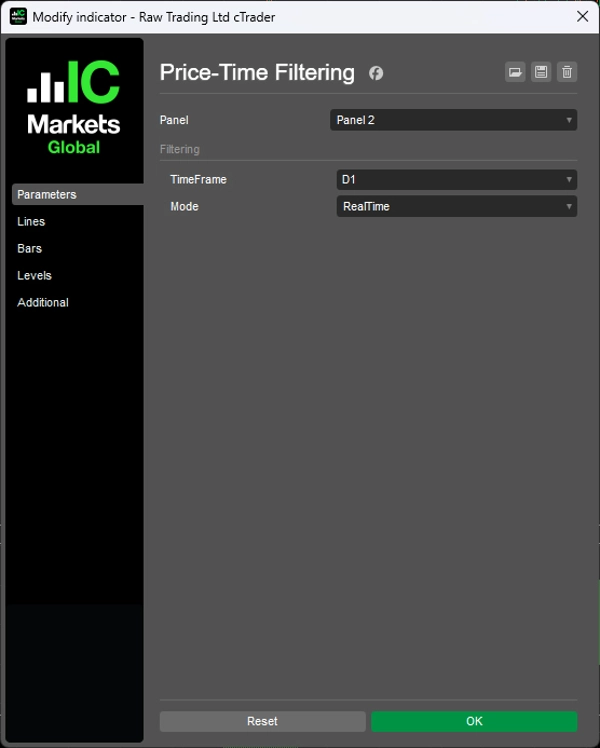
1. PeriodEnd 모드 상위 시간대 기간이 완료될 때만 추세를 평가합니다. 이는 원래 방법론과 일치하며, 주간 추세는 금요일 종가(또는 월간은 월말 종가)로 결정됩니다. 더 안정적이고 신호가 적습니다.
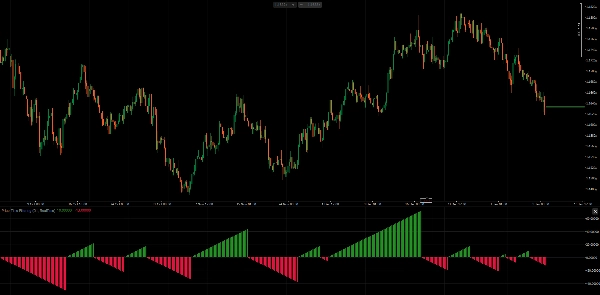
2. RealTime 모드 현재 종가를 이전 기간 범위와 비교하여 모든 바에서 추세를 평가합니다. 더 빠른 신호를 제공하지만 기간 중 잡음이 더 많을 수 있습니다.
매개변수
- TimeFrame: 추세 평가를 위한 상위 시간대 (예: 주간, 월간)
- Mode: PeriodEnd (원래 방법론) 또는 RealTime (반응형 변형)
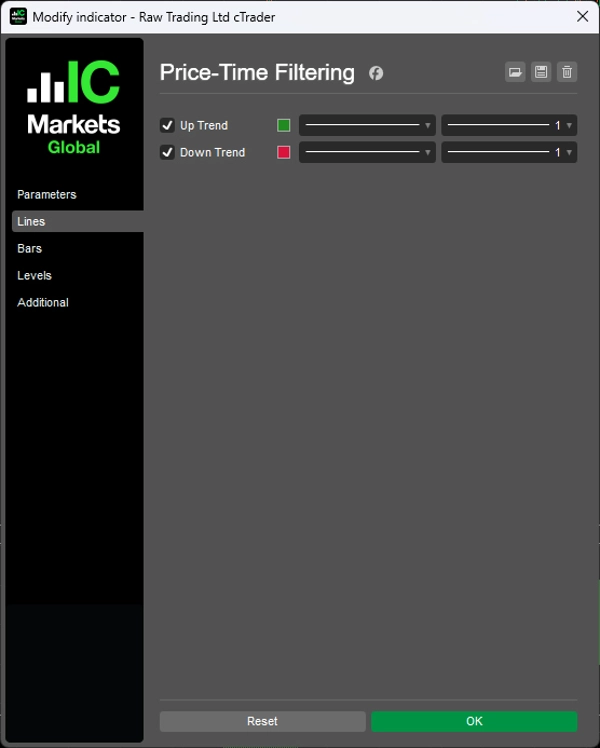
해석
- 녹색 히스토그램: 진행 중인 상승 추세, 바 수는 지속 기간을 나타냄
- 빨간색 히스토그램: 진행 중인 하락 추세, 바 수는 지속 기간을 나타냄
- 히스토그램 리셋: 추세 반전 발생
이 지표는 원래 기사에 설명된 대로 주간 또는 월간 시간대 선택과 함께 일간 차트에서 가장 잘 작동합니다. 그러나 구현은 모든 시간대 조합을 지원합니다.
참고
- 원래는 주간/월간 평가가 포함된 일간 차트를 위해 설계됨
- 선택한 시간대가 차트 시간대보다 높은 모든 시간대 조합에서 작동
- 바 수는 추세 성숙도를 측정하며, 더 긴 수치는 확립된 추세를 나타냄
- 진입 타이밍을 위해 가격 구조 분석과 결합 고려
참고문헌
Tagher, Alfred François. "Trend Identification By Price And Time Filtering." Technical Analysis of Stocks & Commodities, 2024년 2월.
__________________________________________________________________________________________
더 많은 무료 지표
구조 및 거래량부터 회귀, 변동성, 맞춤 시간대에 이르기까지 다양한 시장 분석 도구를 탐색하세요.
소스 코드는 GitHub 저장소에서 확인할 수 있습니다.
모두 무료로 사용할 수 있습니다. 하지만 커피 지원을 보내고 싶다면 여기로 보내실 수 있습니다.
지지/저항
거래량
이동 평균
- SSL 채널
- 앵커드 이동 평균
- 편차 스케일 이동 평균
- 간 하이 로우 액티베이터
- 순간 추세선
- 트렌드 비전이 포함된 카우프만 적응형 MA
- 이동 평균 채널
- 이동 평균 모음
- 추세 채널 이동 평균
유틸리티/커스텀
회귀 기반
변동성
오실레이터
__________________________________________________________________________________________
면책 조항
거래에는 위험이 따릅니다. 이 지표는 기술적 분석용으로만 의도되었으며 항상 적절한 위험 관리를 적용하고 책임감 있게 거래하십시오.
피드백 및 개선 사항
제안, 기능 요청 또는 개선 아이디어가 있으면 토론 탭에 댓글을 남겨주세요. 여러분의 피드백은 모두를 위한 지표 개선에 도움이 됩니다.
요약
The indicator supports two filtering modes: PeriodEnd mode, which evaluates trends only at the close of a higher timeframe period (e.g., weekly or monthly), providing more stable signals; and RealTime mode, which updates trend status on every bar for more responsive but potentially noisier signals. Users can select the higher timeframe for trend evaluation, typically weekly or monthly, while applying the indicator on lower timeframe charts.
A histogram visually represents trend direction and duration, with positive values and green bars indicating uptrends, negative values and red bars indicating downtrends, and resets marking trend reversals. The indicator is applicable across various markets including Forex, indices, commodities, crypto, and stocks, and supports any timeframe combination where the selected higher timeframe exceeds the chart timeframe.