
S&R Structural ZigZag
지표
602 다운로드
버전 1.0, Jun 2025
Windows, Mac
5.0
리뷰: 1
설명
Pinescriptlabs 스토어 지표: 🤖Pinescriptlabs 스토어 cBots : (cBot)
PRICE ACTION (신규)
지그재그 서포트 & 레지스턴스와 스윙
1. 이 지표는 무엇을 하나요? ❓
🔍 가격 스윙(고점 & 저점)을 감지합니다
- 최근 바("분석 깊이")를 스캔하여 해당 범위 내에서 가장 높은/낮은 가격을 찾습니다.
- 스윙을 % 임계값으로 검증합니다 (예: 마지막 스윙 대비 1% 이상 변화) → 새로운 ✅ 스윙 고점/저점을 표시합니다.
- 노이즈를 줄입니다 ⚡: 분석 기간의 절반 동안 더 높은 고점/더 낮은 저점이 없을 때만 스윙을 확인합니다.
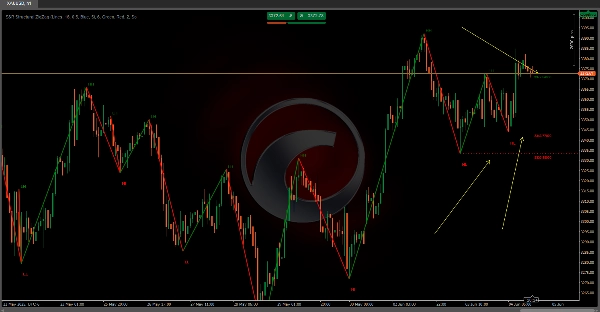
📉 지그재그 추세선을 그립니다
- 스윙을 동적 선으로 연결합니다:
-
- 🟢 초록 = 상승 추세 (새 스윙 > 이전).
- 🔴 빨강 = 하락 추세 (새 스윙 < 이전).
⏹️ 주요 레벨 강조
- 서포트/레지스턴스 라인: 각 스윙의 정확한 가격에 그려지며 오른쪽으로 연장됩니다.
- 라벨은 즉각적인 분석을 위한 가격 값을 표시합니다 📌 (예: "1.1050").
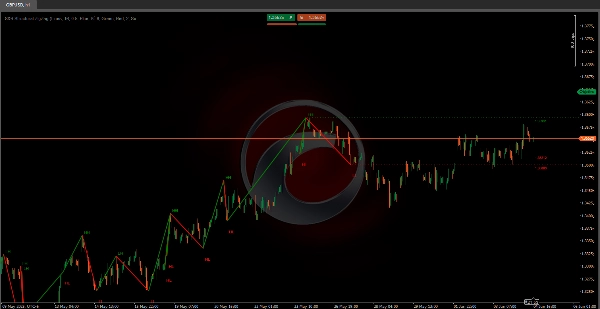
🚦 시장 구조를 보여줍니다
- 한눈에 추세를 식별합니다:
-
- 강세 = 고점 상승(HH) + 저점 상승(HL).
- 약세 = 고점 하락(LH) + 저점 하락(LL).
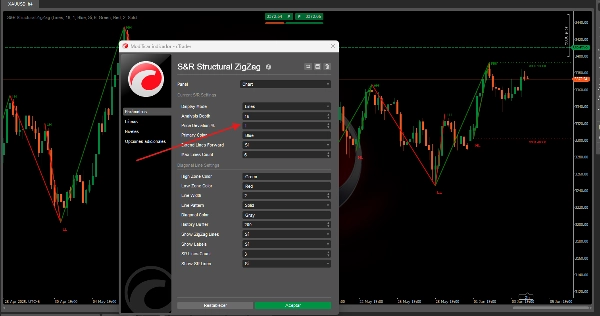
2. 사용 방법 (설정 가이드) ⚙️
cTrader에 설치: 차트에 드래그 앤 드롭하세요!
주요 설정:
- 분석 깊이 🔎:
10(기본값) → 높은 값은 노이즈를 필터링하고 낮은 값은 더 많은 스윙을 포착합니다. - 가격 편차 % 📏:
1.0%(조정 가능) → 스윙을 검증하는 최소 가격 변화량. - 스윙 라벨 🏷️ (HH/HL/LH/LL): 켜기/끄기 전환.
- 라인 확장 ➡️: S/R 레벨을 무한히 투사하거나 현재 바에 한정합니다.
요약
지표 프로필
고객 리뷰
5.0
리뷰: 1
5 | 100 % | |
4 | 0 % | |
3 | 0 % | |
2 | 0 % | |
1 | 0 % |
고객 리뷰
August 18, 2025
Clear structural support/resistance mapping, customizable, lightweight. Cons: No auto-labels, no historical level tracking, no alerts.
상담
자주 묻는 질문(FAQ)
BTCUSD
Breakout
Supertrend
Commodities
RSI
Crypto
XAUUSD
트레이딩 봇, 지표, 플러그인 등 cTrader Store에서 제공되는 상품은 제3자 개발자에 의해 제공되며, 이는 단순히 정보 및 기술적 접근을 목적으로 제공된 것입니다. cTrader Store는 중개인이 아니며, 투자 조언, 개인별 추천 또는 향후 성과에 대한 어떠한 보장도 제공하지 않습니다.


가격
가입일 03/10/2024
163
판매
37.72K
무료 설치